
If you’re looking for the latest marketing statistics and trends, you’re in the right place.
From cart abandonment to e-commerce marketing, I’ve covered everything you need to know to better inform your online strategy.
Let’s get started.

Marketing Statistics You Need to Know
1. B2B Sales Statistics
Get your prospecting wrong and the whole sales process falls apart. You won’t generate enough leads, or worse, you’ll waste time speaking to people who were never a good fit for your product.
With that in mind, here are 10 eye-catching prospecting statistics you need to know.
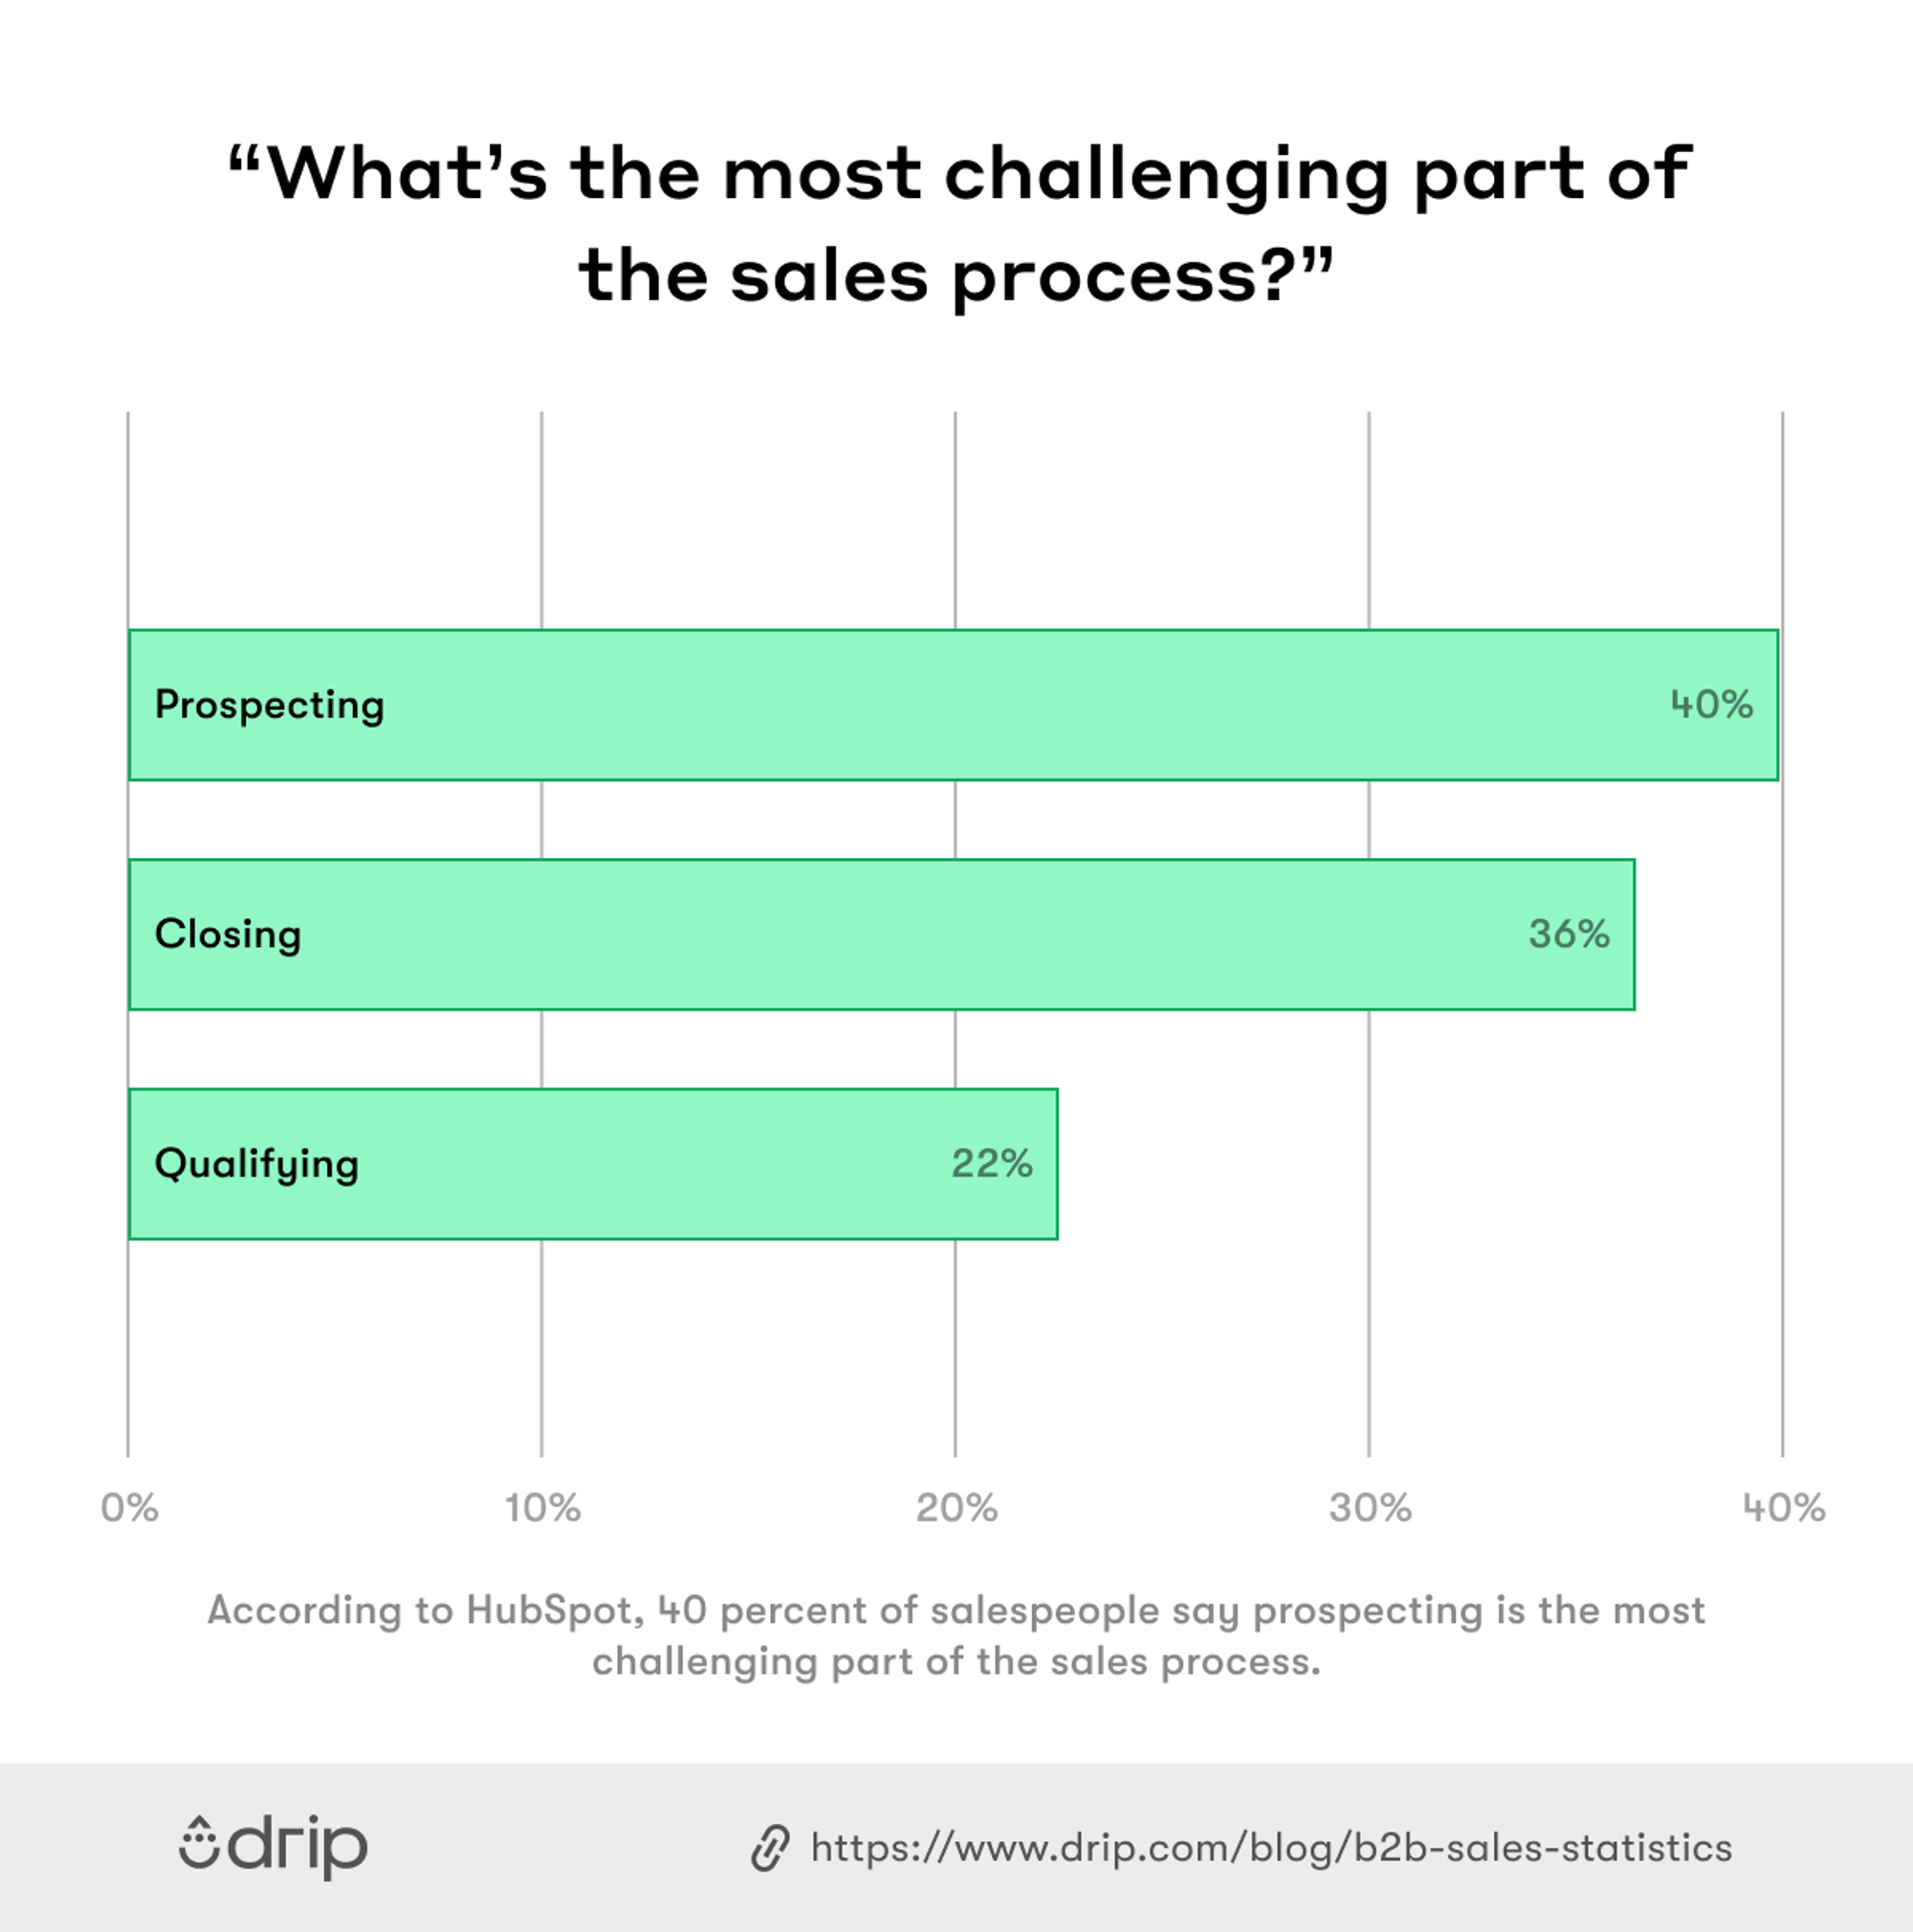
Around 40 Percent of Salespeople Say Prospecting Is the Hardest Part of the Sales Process (HubSpot)
Effective prospecting is essential for hitting your sales goals.
If you’re not filling your pipeline with enough prospects (of the right kind), you won’t generate enough qualified leads, which means you won’t close enough deals.
But no one said prospecting is easy. Quite the contrary, in fact, with more than 40 percent of salespeople describing it as the most challenging part of the sales process.
 This would surprise a lot of non-salespeople; they’d expect the hardest part to be closing the deal. Putting yourself out there, asking for business, and risking getting shot down. Terrifying, right?
In reality, the closing was rated as the second most challenging part of the process (with 36 percent of the vote), followed by qualifying (22 percent).
Other B2B Sales Statistics
- 77 percent of B2B decision-makers say they’d rather meet with vendors via video than on a phone call (McKinsey)
- At least 50 percent of prospects aren’t a good fit for what you sell (Sales Insight Lab)
- 70 percent of B2B decision-makers are open to making new, fully self-serve or remote purchases in excess of $50,000 (McKinsey)
- 76 percent of salespeople cite sales technology as “critical” or “extremely critical” to closing deals (LinkedIn)
- 77 percent of B2B buyers say their latest purchase was either “difficult” or “very complex” (Gartner)
- 80 percent of frequent B2B buyers have switched suppliers at least once within a 24-month period (Accenture)
- 76 percent of B2B buyers now expect more personalized attention from solution providers based on their specific needs (DemandGen)
- Competitive pricing is the most important factor for a majority of B2B buyers (Accenture)
- 88 percent of B2B buyers only buy when they see a salesperson as a “trusted advisor” (LinkedIn)
2. E-Commerce Statistics
If you’re like most e-commerce marketers, you’re always looking for new ways to boost your website traffic, grow your email list, and sell more products.
However, for new marketing strategies to be effective, you first need to understand how potential customers behave online, as well as what they need and value most.
Here are 10 e-commerce statistics to help you do that.
There Are 2.14 Billion Online Shoppers Worldwide (Statista)
Online shopping is getting bigger each year. With the Covid19 pandemic, more consumers are going online to buy everything from groceries to luxury items.
As a result, Statista estimates that there will be 2.14 billion global buyersonline by the end of 2021.
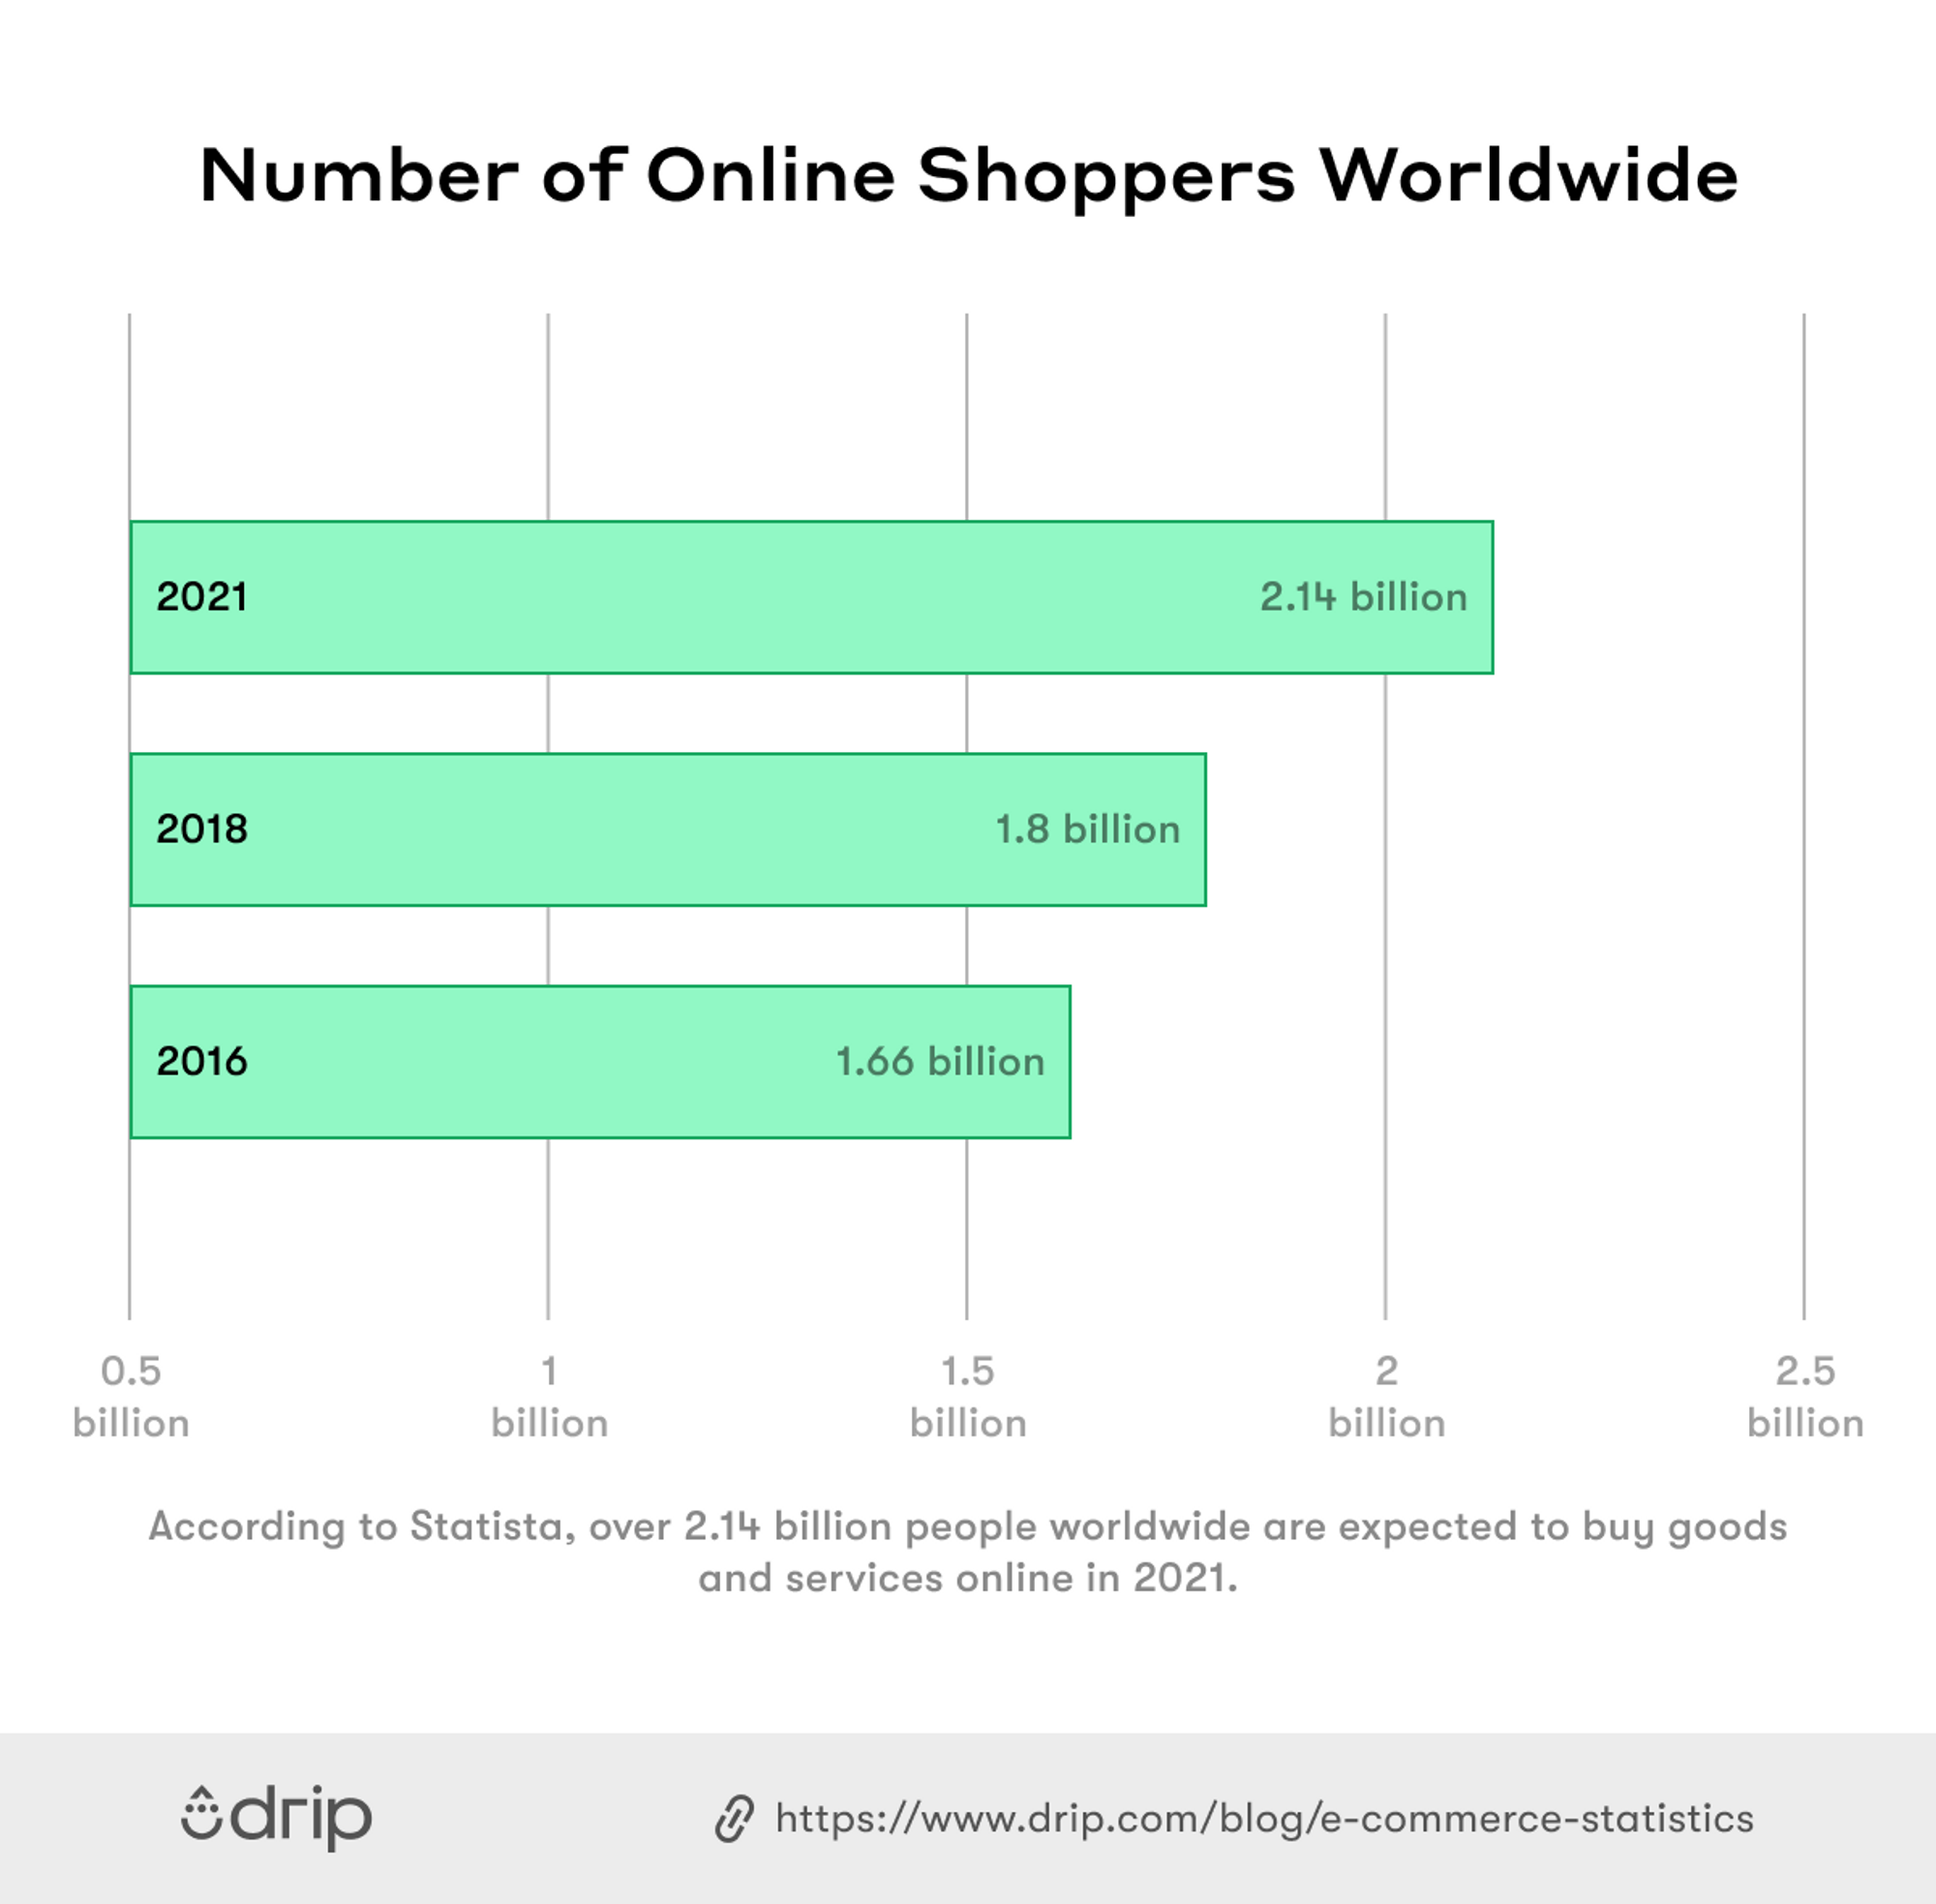 Considering that number increased from 1.66 billion in 2016, global e-commerce growth won’t stop anytime soon. What do these numbers mean for you?
If you’re not already selling online, this should be your call to do so. And if you’re unsure how to get started, read our article reviewing the best e-commerce platforms.
Other E-Commerce Statistics
- Only 2.17 percent of e-commerce visits convert into purchases (Statista)
- E-commerce accounts for 18 percent of all retail sales (Statista)
- Amazon is expected to account for 50 percent of all retail sales in 2021 (Statista)
- E-retail sales are projected to grow to $5.4 trillion in 2022 (Statista)
- 61 percent of online retail traffic comes from mobile (Statista)
- 68 percent of online shoppers search a product on google before purchasing (Statista)
- Fashion shoppers view 32 pages before making a purchase (Statista)
- Shoppers value in-stock availability and fast delivery most (Statista)
- 3D product images increase conversions by 250 percent (Shopify)
3. Black Friday Statistics
Once a year, shoppers the world over momentarily lose their minds and buy, buy, buy to stock up for the Christmas season.
In a tryptophan-induced stupor, they wake up at the crack of dawn to find massive deals, shelling out huge amounts of money in the process.
I’m talking, of course, about Black Friday. Here are the most important statistics to familiarize yourself with.
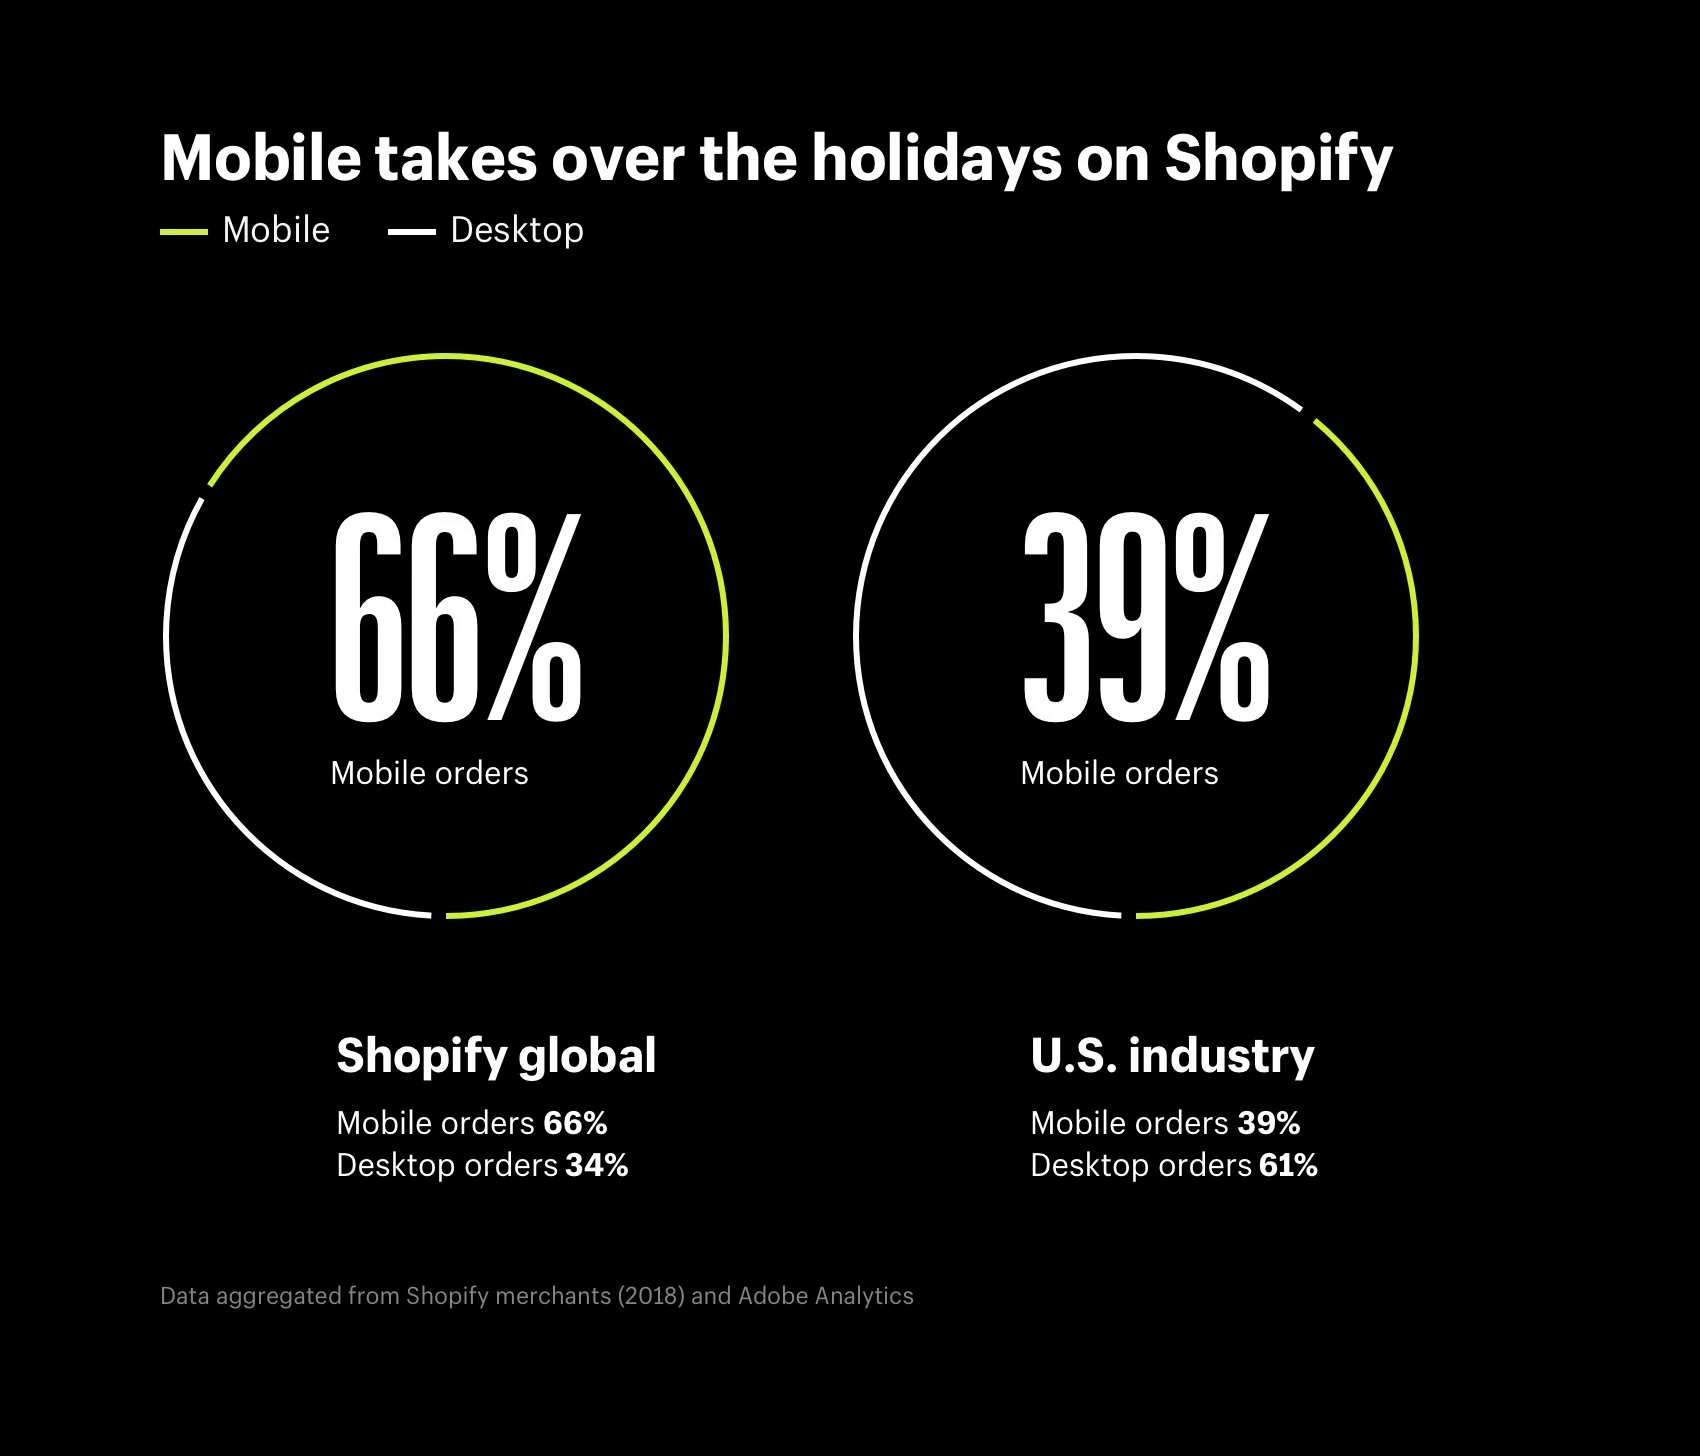
Mobile Transactions Account for 66 Percent of Global Black Friday Sales (Shopify)
It’s no surprise that a growing percentage of e-commerce shoppers prefer to use their mobile devices rather than a desktop.
But I was amazed to learn that two-thirds of global Black Friday sales for Shopify merchants came from mobile in 2018.
And I could only imagine that that number will increase in 2022. This shows firsthand the importance of having your e-commerce store fully optimized for mobile.
Otherwise, any friction is going to put a damper on your revenue.
As Shanelle Mullin of ConversionXL explains, simply using responsive web design (RWD) doesn’t mean a store is fully optimized.
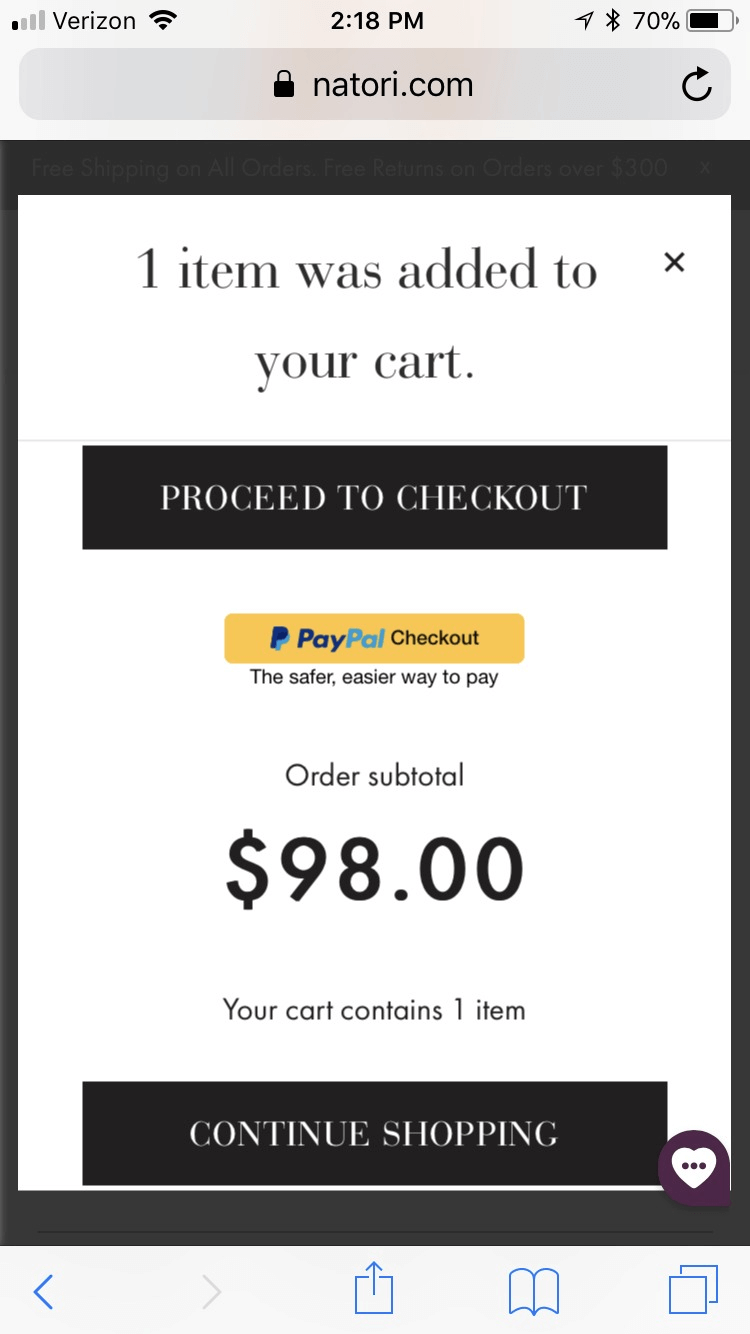
Besides that, you can offer a one-click purchasing option for mobile-first customers to avoid them having to fumble with manually entering their credit card information. Instead, they simply choose the mobile wallet they use and authenticate with either a Touch ID or PIN.
For instance, lingerie and clothing company Natori offers one-click PayPal checkout to remove friction when making a purchase.
 Source: BigCommerce
To learn more about how to simplify your mobile checkout, check out our article on mobile optimization best practices.
Other Black Friday Statistics
- 70 percent of shoppers won’t be going to brick-and-mortar stores to do their shopping anytime soon (The Drum)
- 116.5 million emails are sent on Black Friday—more than any other day of the year (Campaign Monitor)
- Cart abandonment emails have a 34 percent open rate and a 9 percent click-through rate during Black Friday (Campaign Monitor)
- Targeted Black Friday emails get 5.83 percent more opens than non-targeted emails (Shopify)
- SMS marketing can result in as much as a 2000 percent ROI during Black Friday (Statista)
- Black Friday discounts now average nearly 50 percent (Numerator)
- UK shoppers are expected to spend almost £9.2bn in 2021 (The Guardian)
4. Cart Abandonment Statistics
How does it feel watching visitors load their carts on your Shopify store only to leave without buying, perhaps never to return? I know, it’s painful, isn’t it?
Beyond hurt feelings, cart abandonment means loss of revenue and profits, but you’re not alone—cart abandonment is a problem every retailer faces.
Here’s what you need to know. Plus, a few strategies to help.
The Average Cart Abandonment Rate is Just Under 70 Percent
Google “shopping cart abandonment rate,” and you’ll find data from a ton of different studies.
I’ve seen rates as low as 56 percent and as high as 81 percent. However, I think recent data from the Baymard Institute paints the most accurate picture.
Baymard calculated data from more than 41 different studies and found that the average cart abandonment rate is just under 70 percent.
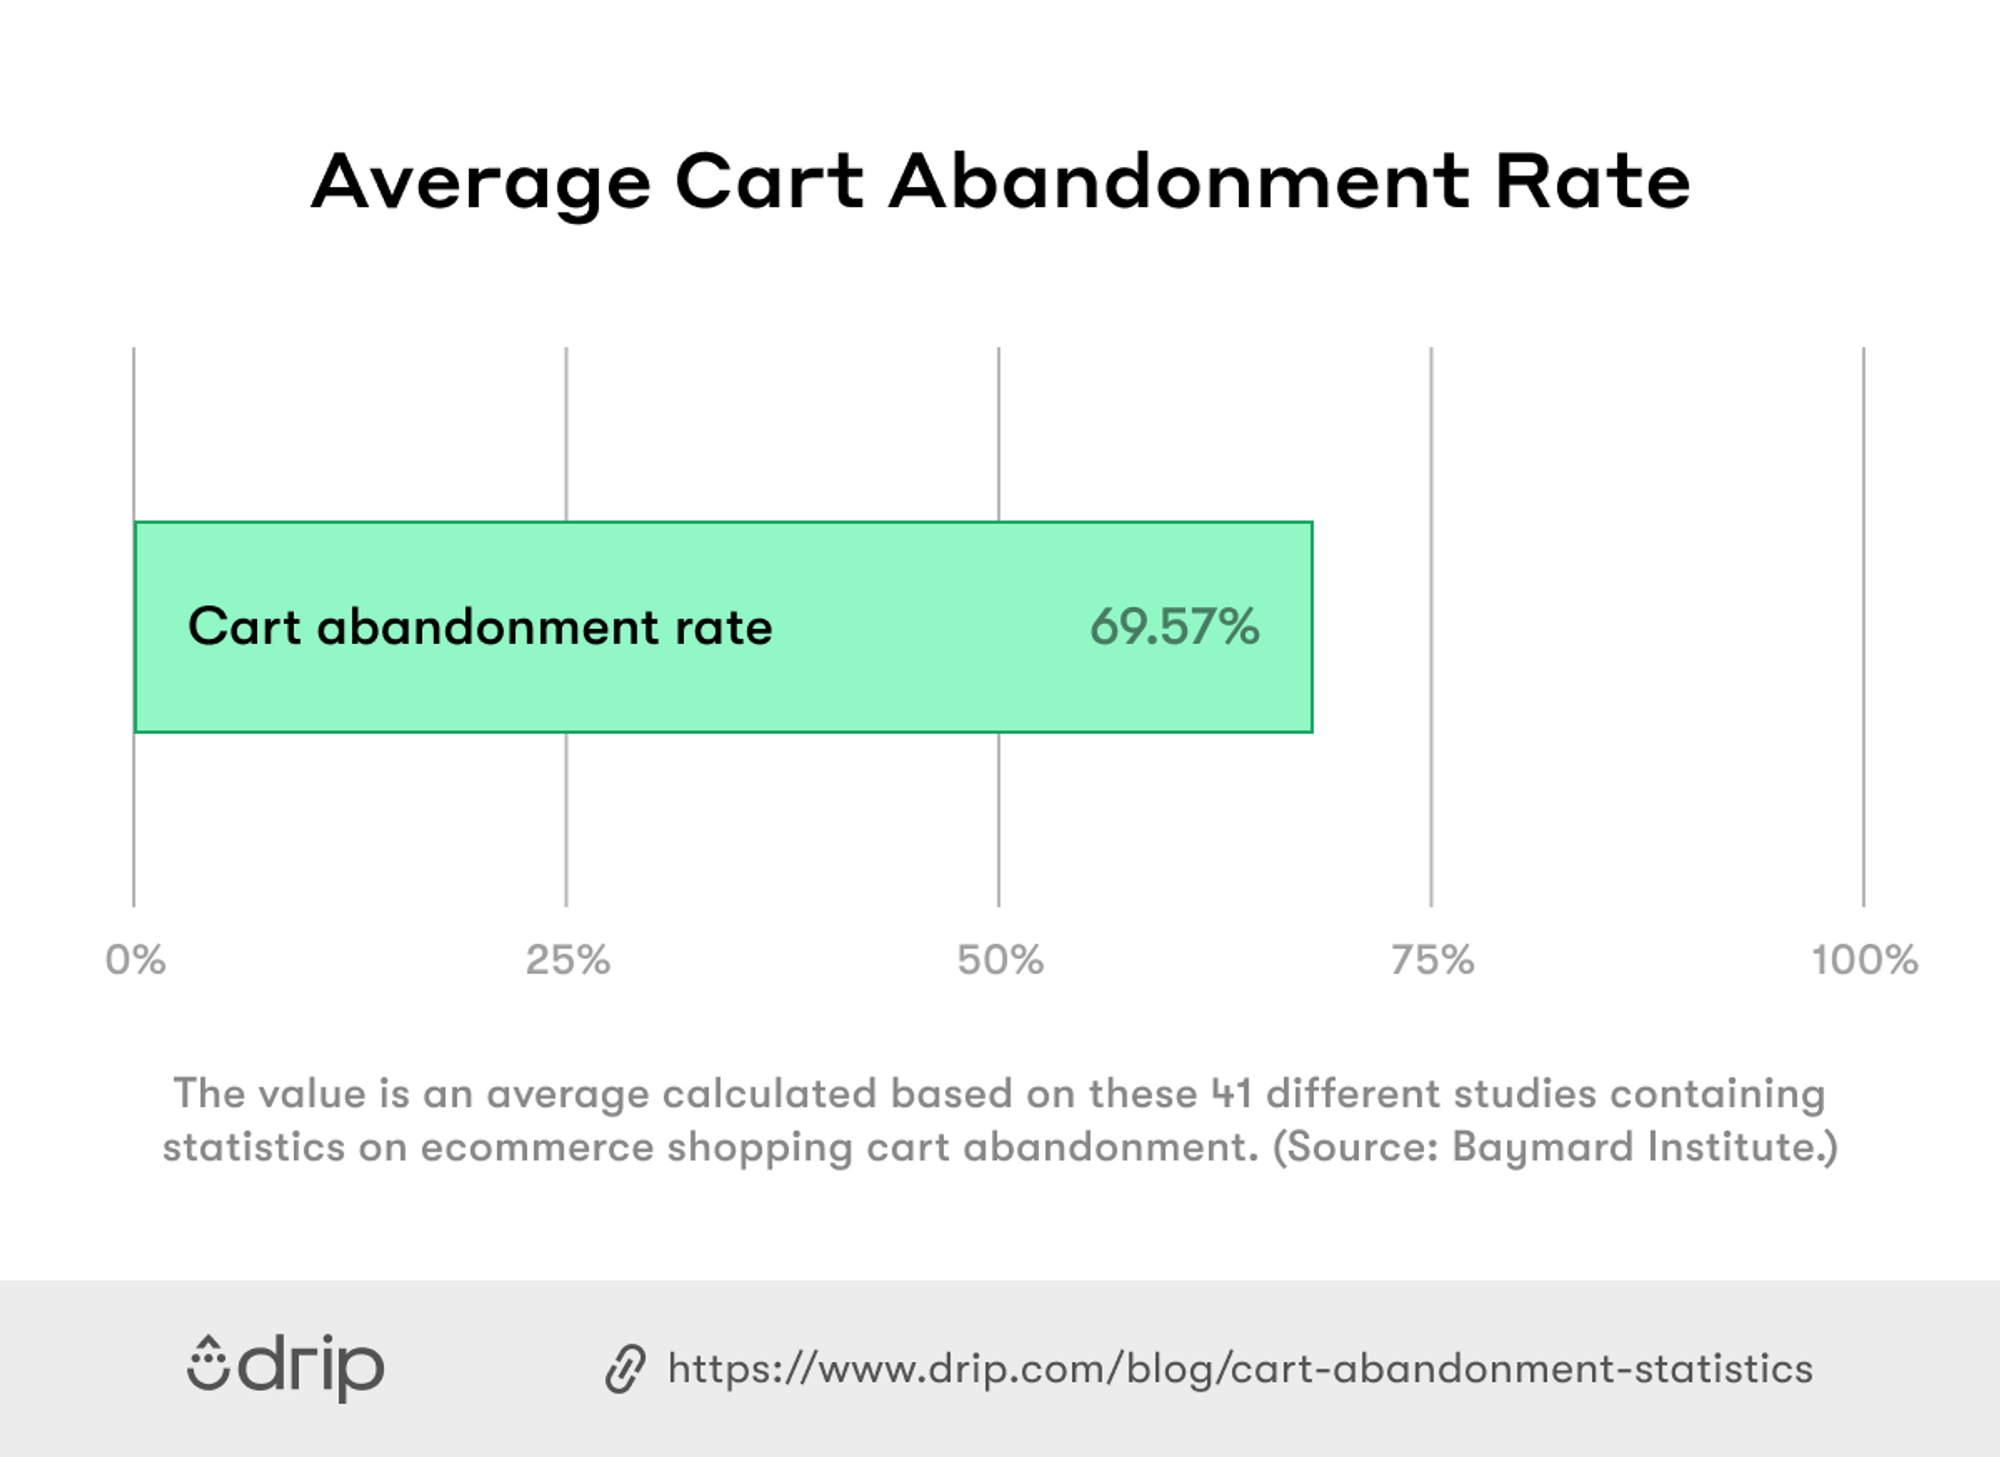 That means roughly seven out of every 10 shoppers won’t complete their transaction—a number many e-commerce store owners find more than troubling.
Fortunately, you can reduce that number to a large degree by having a robust strategy, which includes, but is not limited to, combining cart recovery popups with cart recovery emails.
Other Cart Abandonment Statistics
- Mobile users have an even higher abandonment rate of 85.65 percent (Barilliance)
- E-commerce brands lose $18 billion in sales revenue each year because of cart abandonment (Dynamic Yield)
- Checkout optimization can increase conversions by 35.62 percent (Baymard)
- Extra costs are the number one reason why shoppers abandon (Baymard)
- Being forced to create an account is the number two reason people abandon (Baymard)
- 57 percent of shoppers will abandon if they have to wait three seconds for a page to load (HubSpot)
- The average checkout flow has 23.48 form elements and 14.88 form fields (Baymard)
- 55 percent of shoppers will abandon if they have to re-enter their credit card or shipping information (Statista)
- 46 percent of shoppers abandon because a discount code doesn’t work (Statista)
5. Email Marketing Statistics
Email marketing statistics change almost seemingly overnight.
Marketers must stay in tune with email marketing statistics because they have a massive impact on how we view the marketing landscape and how we conduct marketing activities.
One of the main reasons why e-commerce brands have historically been so successful with this channel is the sheer number of people who use email daily.
Let’s discuss what that means for you.
99 Percent of People Check Their Email Every Single Day (HubSpot)
Even though newer, sleeker, sexier digital marketing strategies are constantly popping up, email continues to be insanely effective because of this fact.
And this has never been more true than it is in 2021. Recent data from HubSpot discovered that a staggering 99 percent of people check their email every single day.
Not only that, “more than 50 percent of U.S. respondents check their personal email account more than ten times a day, and it is by far their preferred way to receive updates from brands.”
Another fact I found interesting was that the vast majority of millennials (73 percent) prefer communicating with brands through email than any other medium.
There’s simply a level of convenience that email provides that’s hard to replicate. So when it comes to reaching a massive percentage of your demographic promptly, email is still the top dog.
Other Email Marketing Statistics
- 59 percent of respondents say marketing emails influence their purchase decisions (HubSpot)
- 73 percent of companies today prioritize mobile device optimization when creating email marketing campaigns. (HubSpot)
- Personalized emails have an average open rate of 18.8 percent, while those that aren’t personalized have an average open rate of 13.1 percent. (Campaign Monitor)
- Including videos in your emails can increase your CTR by a whopping 300 percent. (Backlinko)
- Adding a call to action button in your emails instead of simply a text link can lead to a 28 percent increase in click-throughs (Backlinko)
- Adding social share buttons can boost your CTR by as much as 158 percent. (Backlinko)
- Most brands (54 percent) send emails 2–4 times per month (Snov.io)
6. Holiday Shopping Statistics
For many of us, the holiday season is a long-awaited chance to take our foot off the gas, unwind with friends and family, and consume our body weight in roasted meats.
But relaxation is the last thing on a retailer’s mind.
Often, the holidays can make or break the whole retail year. Across all verticals, Q4 accounts for 26.8 percent of total annual retail sales—not substantially more than an average quarter.
However, in some sectors, the holiday quarter has greater significance. For instance, it represents 34.9 percent of hobby, toy, and game sales; 34.7 percent of jewelry sales; and 31.1 percent of electronics sales.
With that in mind, here are ten most-know holiday statistics.
Global Online Holiday Spending Is Expected to Hit $910 Billion This Season (Adobe Analytics)
Online spending will hit $910 billion this holiday season, up 11 percent year on year, according to the Adobe Digital Economy Index.
In the US alone, online holiday sales from November 1st to December 31st were expected to reach a record $207 billion.
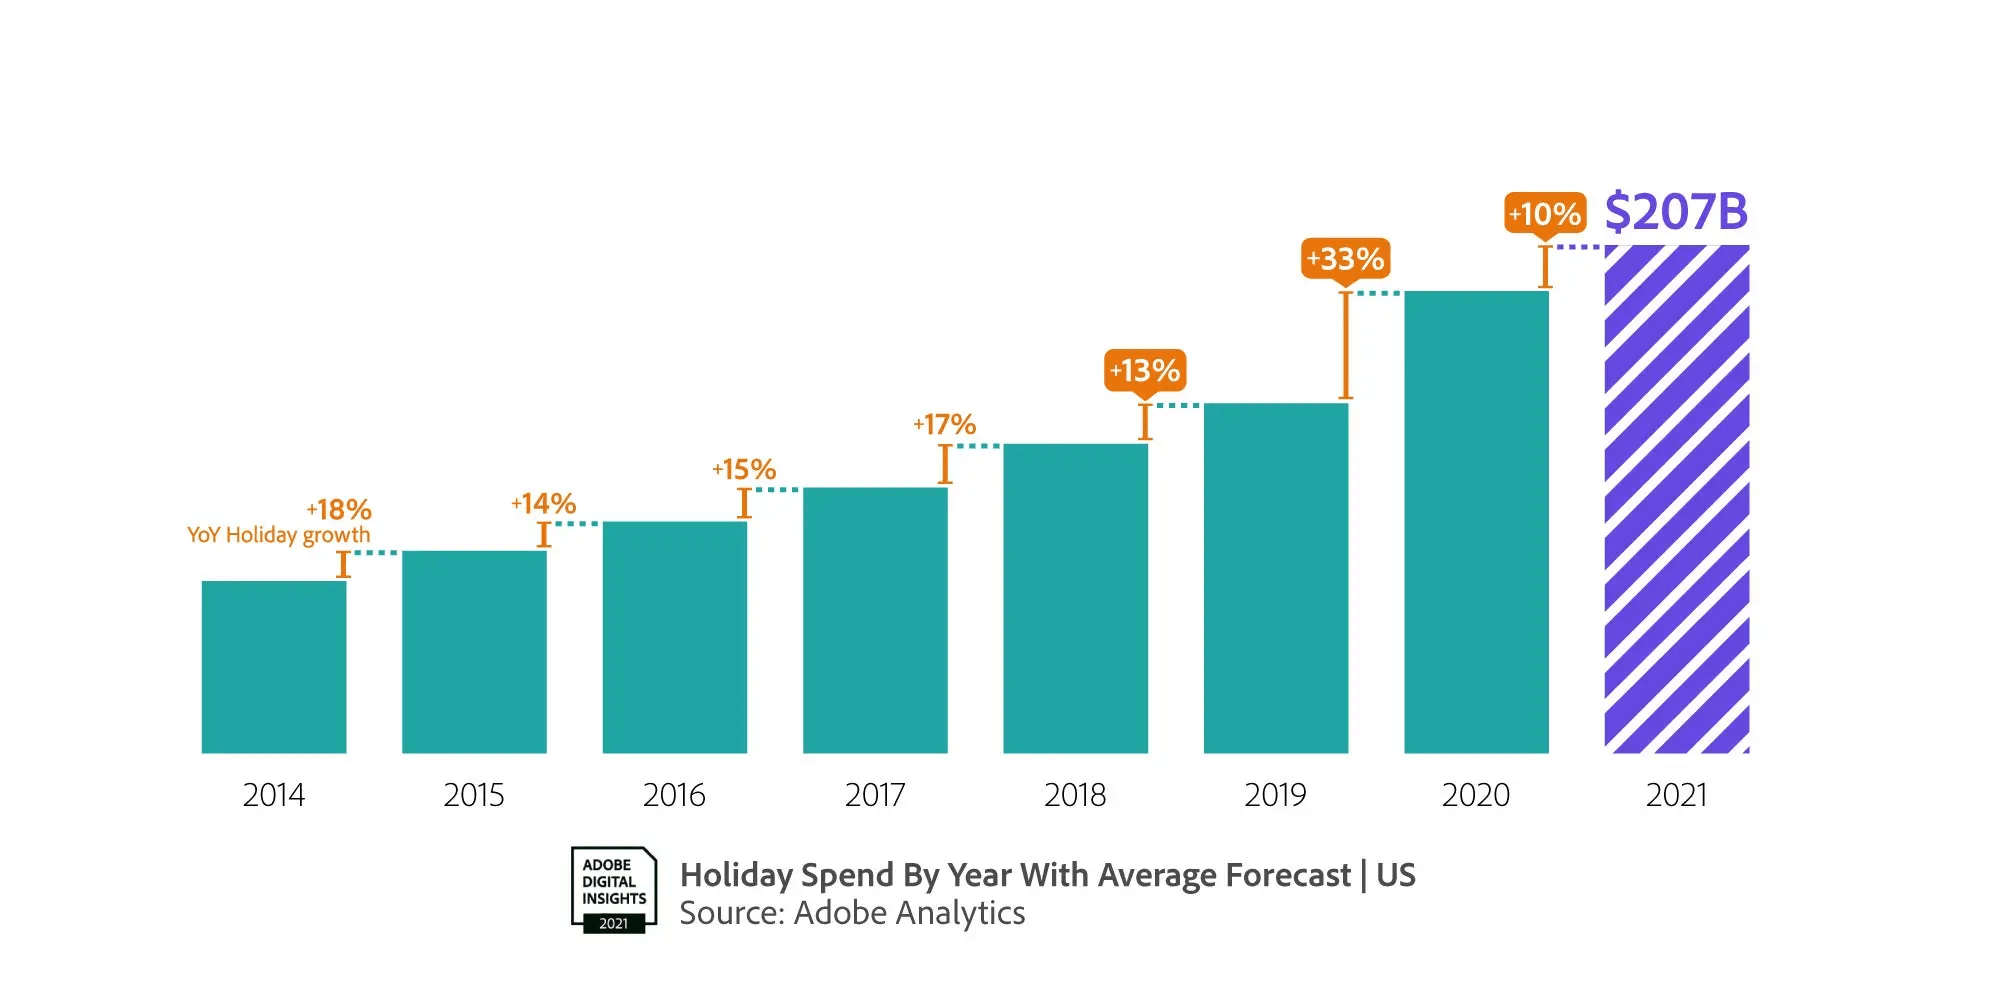 What’s more, Adobe predicts online spending for the full year will pass the $4 trillion mark, representing a new milestone for e-commerce.
It’s a strong return that highlights how the pandemic has transformed online shopping from a convenience to an essential service.
Other Holiday Shopping Statistics
- 29 percent of holiday shoppers plan to spend more than last year (NPD)
- Nearly 2 million more people than last year are expected to shop from Thanksgiving day through Cyber Monday (National Retail Federation)
- 46 percent of shoppers started their holiday shopping earlier than usual in 2021 (National Retail Federation)
- Concerns about availability are the number one reason for consumers to start holiday shopping early (McKinsey)
- 85 percent of consumers will include online shopping in their holiday plans (NPD)
- 47 percent of consumers say free shipping would influence where they buy gifts (NPD)
- Product quality will be the most important factor in choosing between brands (Salesforce)
- Out-of-stock messages have risen 172 percent on pre-pandemic levels going into the holiday season (Adobe Analytics)
- 70 percent of shoppers faced with out-of-stock products have switched retailers or brands instead (McKinsey)
7. Mobile Commerce Statistics
Mobile commerce, also known as m-commerce, is defined as “the buying and selling of goods and services through wireless handheld devices such as smartphones and tablets.”
It’s a big umbrella that can include everything from e-commerce and in-app purchasing to mobile banking and purchasing goods using a digital wallet.
Here’s are a few must-know m-commerce statistics.
Mobile Commerce Sales Will Make Up More Than Half of Total E-Commerce Sales By 2021 (Statista)
Don’t think the mobile commerce trend is slowing down.
Experts predict that by 2021, mobile commerce will account for 53.9 percent of e-commerce sales.
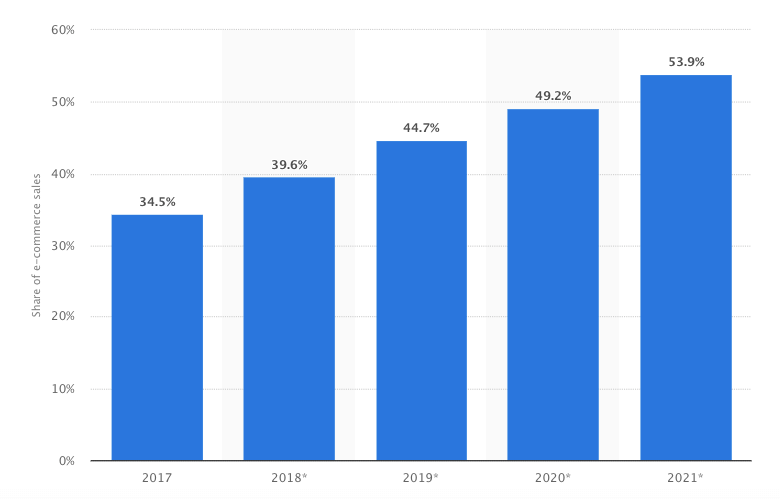
This makes 2021 the tipping point where more e-commerce shopping is done on mobile than on desktop.
And while you don’t want to neglect desktop users, this data proves that mobile users deserve the bulk of your attention in upcoming years.
Other Mobile Commerce Statistics
- Less than one in 10 mobile users will stay on a site or app if it doesn’t satisfy their needs (Think with Google)
- 61 percent of smartphone users say they’re more likely to buy when they receive customized offerings (Think with Google)
- 58 percent of smartphone users are more likely to buy when they can make purchases quickly (Think with Google)
- Apps have a 14 percent higher conversion rate than mobile web (Use Button)
- Roughly 90 percent of mobile time is spent on apps (Hacker Moon)
- Smartphone users are most likely to abandon their shopping carts at 85.65 percent (Annex Cloud)
- Tablet users have a slightly lower abandonment rate at 80.74 percent (Annex Cloud)
8. Online Shopping Statistics
It was just over 25 years ago (1994) when the first documented online purchase was made. Since then, online shopping has grown from being a novel concept to a multi-trillion dollar industry.
Some of the key takeaways are that the overall revenue of e-commerce is growing quickly, nearly half of all online shopping is done through mobile, and much of shopping cart abandonment is preventable.
Here are a few online shopping statistics that’ll help guide your strategy.
E-Commerce Sales Are Expected to Reach $4.9 Trillion by the End of 2021 (Statista)
There’s been significant growth in e-commerce in recent years. In 2014, total sales reached just $1.3 trillion.
But that number has more than tripled in 2020 to $4.2 trillion and is anticipated to keep growing as we move deeper into the 2020s.
.png?width=1664&name=Retail%20E-Commerce%20Sales%20Worldwide%20from%202014%20to%202023(1).png)
Experts have also projected annual revenue to climb all the way to $6.5 trillion in just two years.
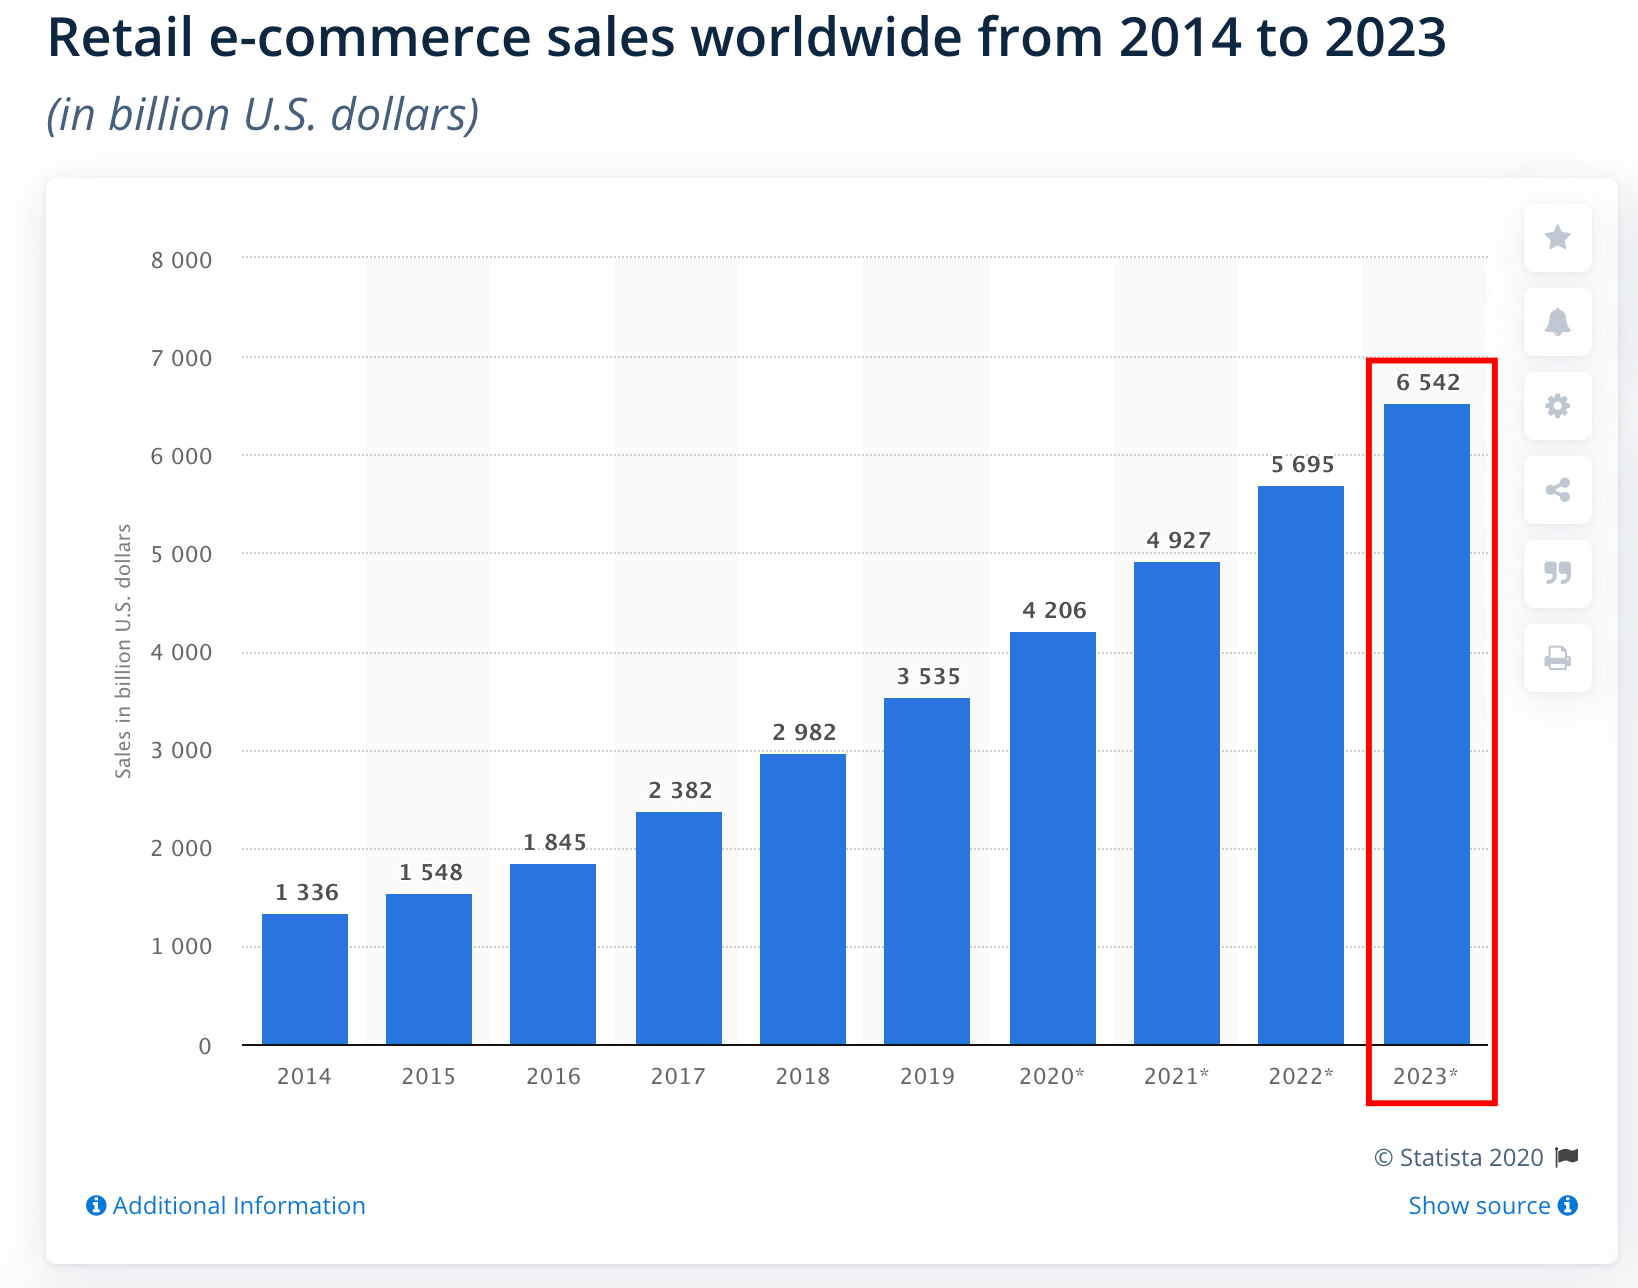 If this trend maintains its trajectory, e-commerce sales could potentially reach $8 trillion per year by 2025.
This is great news for digital brands and shows just how much opportunity there is.
Although the level of competition will certainly increase, so will the revenue.
So, now is the perfect time to jump on board.
Other Online Shopping Statistics
- There Are 2.05 Billion Online Shoppers in 2020 (Oberlo)
- 75 Percent of People Shop Online at Least Once a Month (Statista)
- 63 Percent of Shopping Journeys Start Online (Think with Google)
- Nearly Half (49.2 percent) of E-Commerce Sales Are Made Through Mobile Devices in 2020 (Statista)
- By 2021, 53.9 Percent of E-Commerce Sales Will Be Made Through Mobile Devices (Statista)
- Amazon Accounts for 47 Percent of All US E-Commerce Sales in 2020 (Statista)
- Amazon Will Account for 50 Percent of All US E-Commerce Sales by 2021 (Statista)
- 80 Percent of Online Shoppers and 63 Percent of Mobile Shoppers Think That New Technologies and Innovations Improve Their Experience (National Retail Federation)
- Search and Navigation is The Most Important Site Element for Online Shoppers (Statista)
9. Shopify Statistics
The name Shopify has become synonymous with e-commerce.
Whenever I have an e-commerce conversation with someone, nine times out of 10, the first platform they mention is Shopify.
And for good reason: it’s at the top of the totem pole for many online retailers.
Although it started with humble beginnings back in 2006, it’s since become an industry leader and an absolute leviathan.
Here’s are a few Shopify statistics you need to know.
Shopify Has Nearly 11 Percent of the Total E-Commerce Market Share (Statista)
Although WooCommerce has the largest e-commerce market share at 28.24 percent and Squarespace is second at 17.69 percent, Shopify is firmly positioned in third at 10.98 percent.
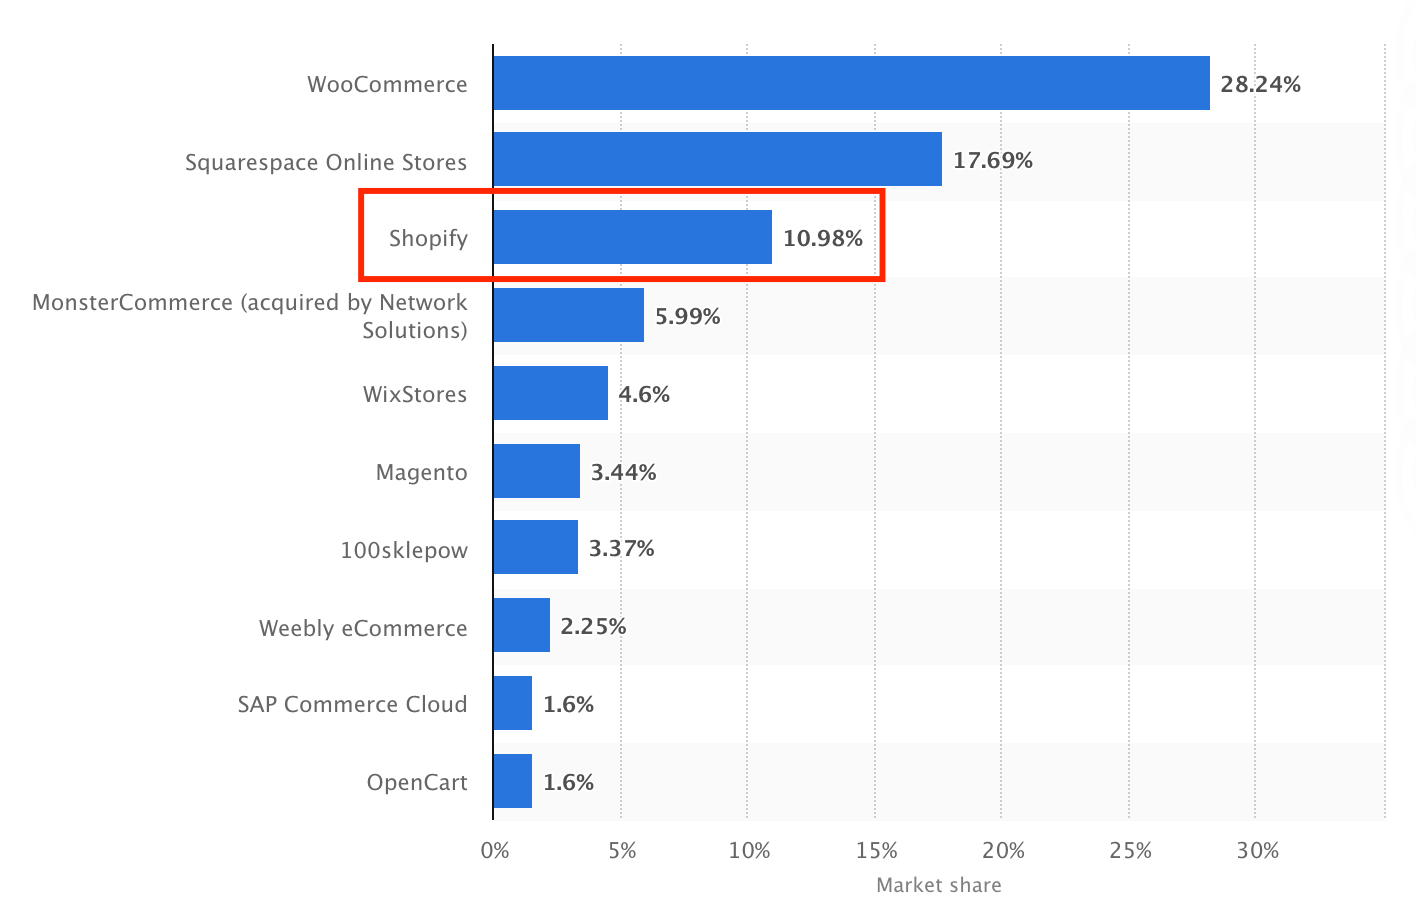 This puts them far ahead of all other contenders like Wix and Magento. And with the way things are going, they should be giving WooCommerce and Squarespace a run for their money soon.
In a mid-2020 press release, Shopify announced that their platform “powers over one million businesses in more than 175 countries” across the globe.
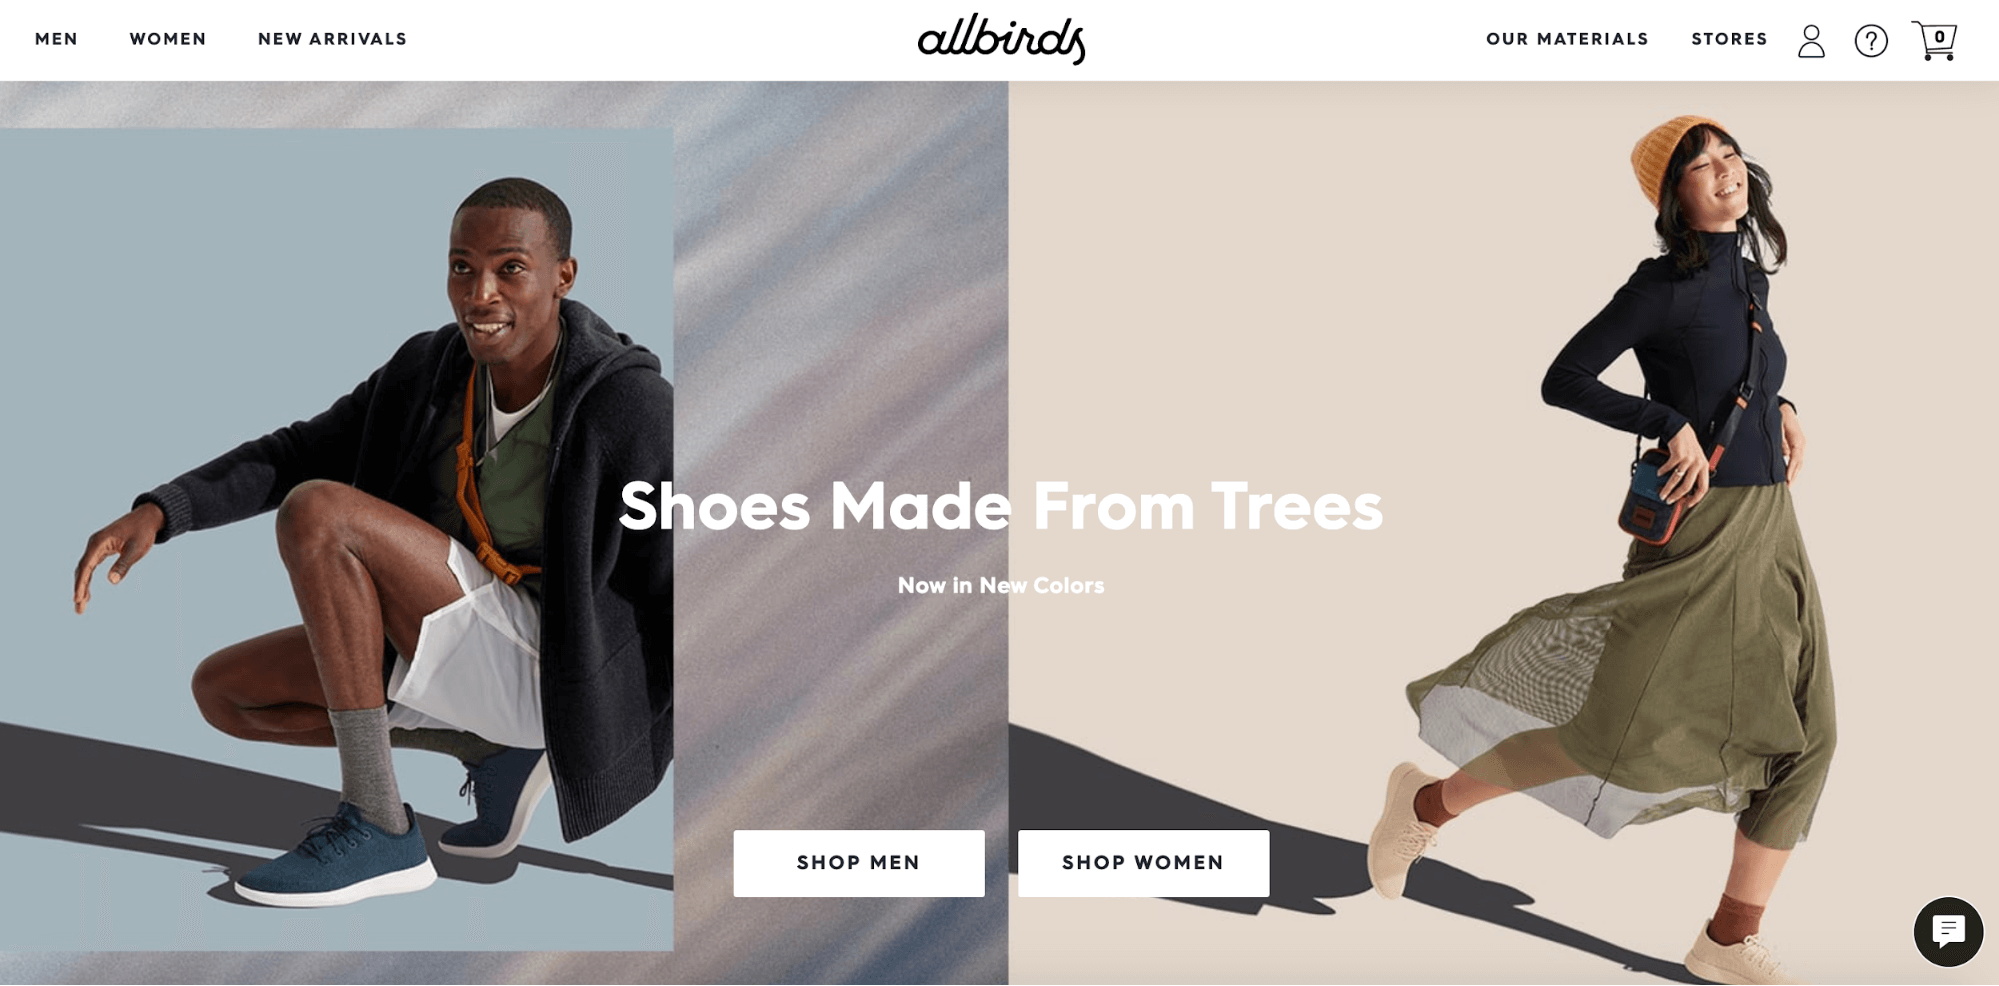
And their list of customers includes some massive brands, including footwear company Allbirds…
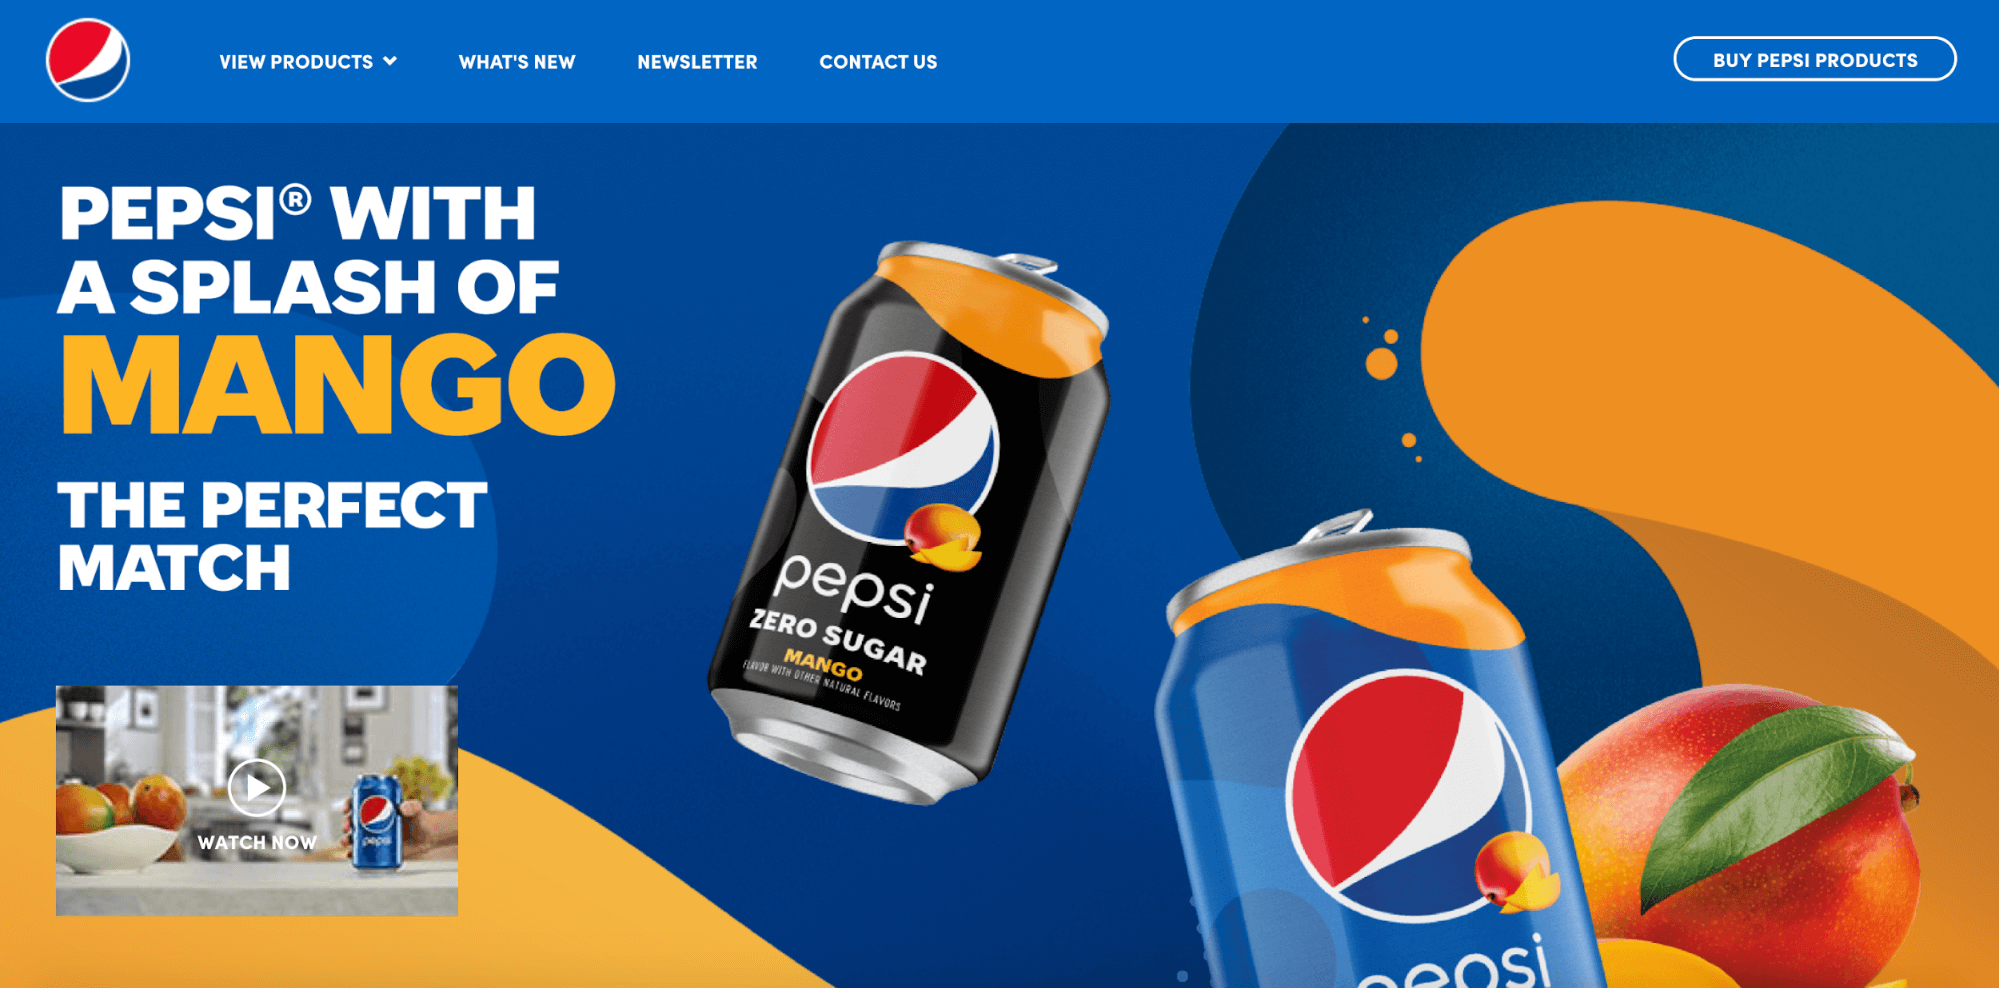
 ...Pepsi…
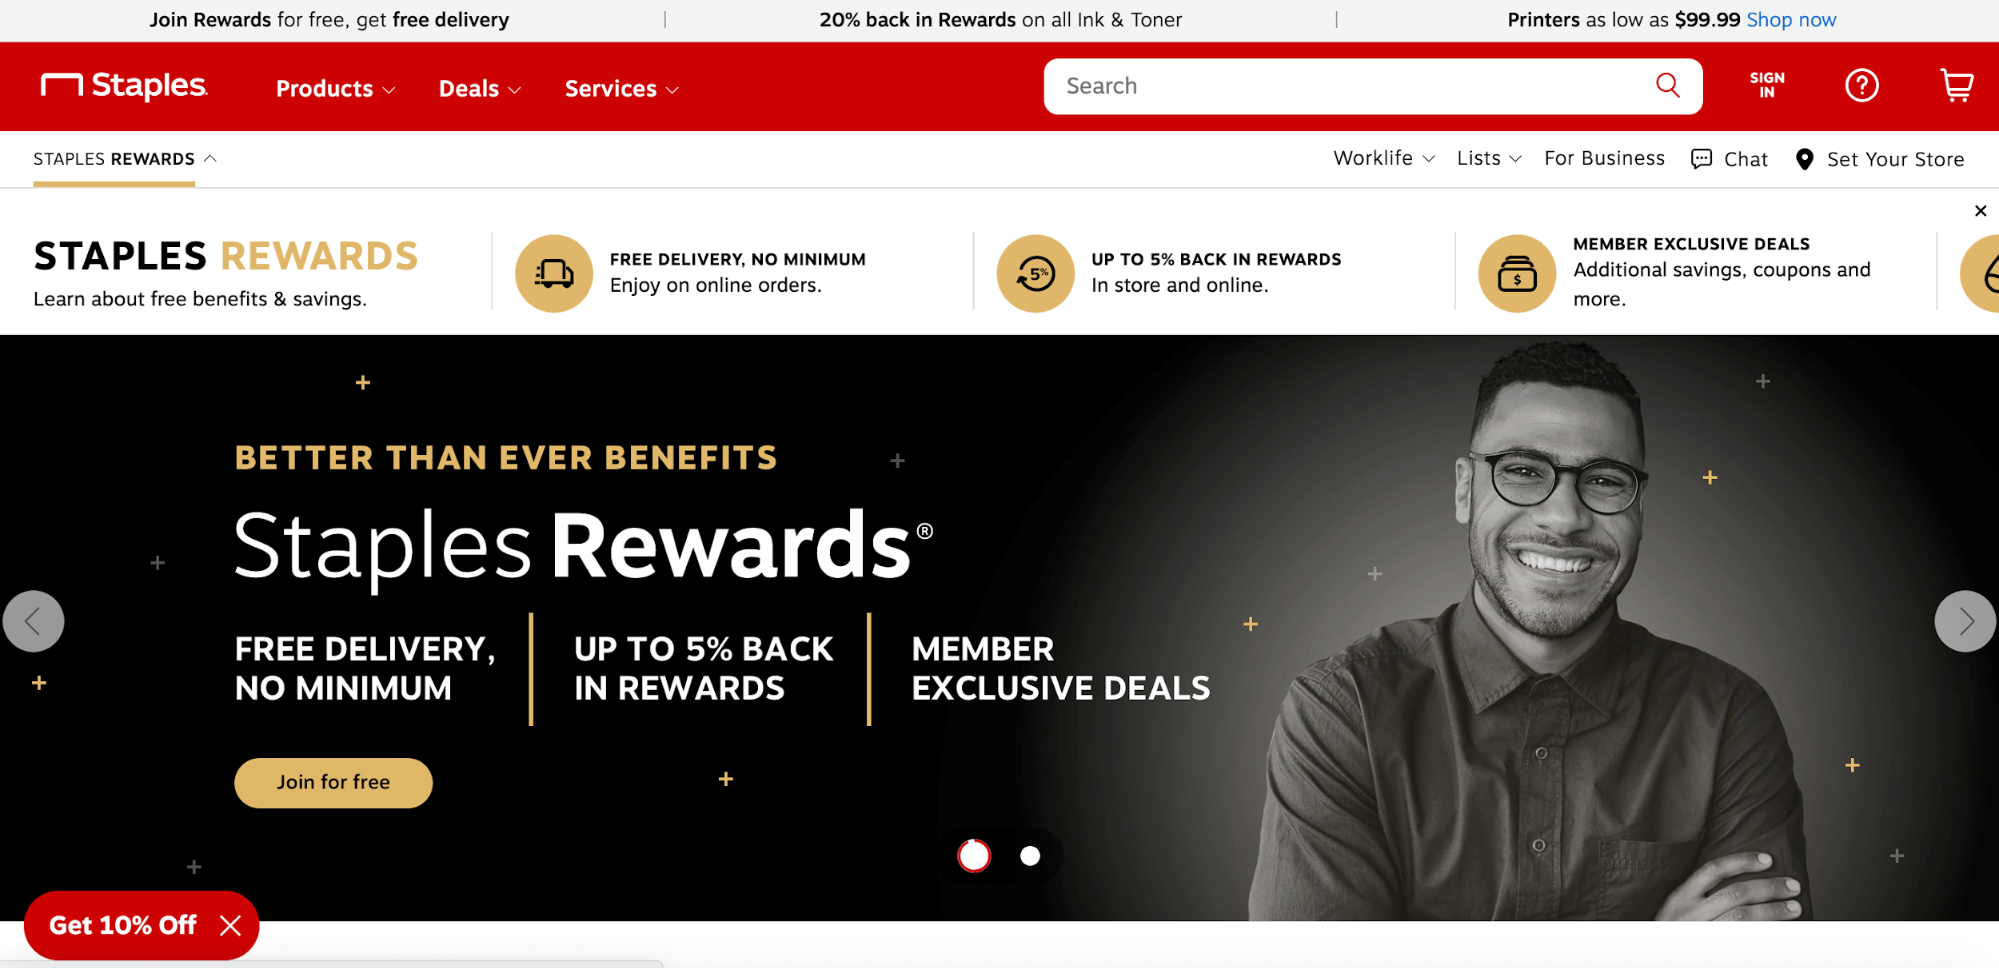
 ...and even Staples.
 Needless to say, Shopify is here to stay.
Other Shopify Statistics
- The number of shoppers who bought from Shopify merchants increased by 52 percent from 2019 to 2020 (Shopify)
- Shopify’s total revenue increased year-over-year by 47 percent (Shopify)
- Shopify’s monthly recurring revenue increases by 48 percent year-over-year (Shopify)
- Shopify has contributed to $319 billion in global economic activity (Shopify)
- Shopify businesses saw a 50 percent increase in online sales in 2019, compared to 21 percent by the global e-commerce market (Statista)
- Over 50 Percent of Shopify Stores Get Repeat Purchases (Shopify)
- 26,400 partners referred a merchant to Shopify in the last year (Shopify)
- The 3 biggest industries on Shopify plus are retail (17 percent), apparel and fashion (11 percent), and computer software (6 percent) (Enlyft)
- The top three countries that use Shopify Plus are the US (62 percent), the UK (10 percent), and Canada (9 percent) (Enlyft)
Conclusion
And that’s it! I’ve covered a lot here. But marketing statistics is a broad topic, and what I covered in this guide is only the beginning.
If you’re interested in keeping abreast of what’s working today, bookmark our category page.
Got a question? Let me know on Twitter @SamThomasDavies.