“Key performance indicator” (KPI) is a classic piece of marketing jargon.
But unlike a lot of marketing jargon (“low-hanging fruit,” anyone?) it actually means something.
KPIs allow you to chart performance toward your business objectives through quantifiable data points or measurements. If you don’t have clearly defined KPIs, you’re effectively leaving things to chance.
Why are they so important?
Imagine your goal is to run a marathon. Would you set off running and hope you manage to reach 42 km? Or would you build a training plan built around key performance indicators, such as how many hours you spend doing cardio in the gym or how long it takes to recover between runs?
However naturally gifted you are, you’ll certainly see better results from the second approach—and ecommerce is no different.
Your goal might be to grow revenue by 20 percent year on year, but how are you going to get there? Rather than hoping it happens, far better to break down your overarching goal into KPIs that:
- Demonstrate whether you’re on the right track; and
- Give you the opportunity to course-correct if things aren’t going as planned.
With that in mind, here are nine vital ecommerce KPIs every brand should be tracking right now.
1. Customer Acquisition Cost
There’s no such thing as an ecommerce business with too many customers.
More than two billion people visit Amazon.com every month, but I can assure you Jeff Bezos doesn’t lie awake at night worrying about all that traffic—he wants more and more.
However, customer growth is only good if it’s sustainable.
If your average order value is €50 but it costs you €75 to acquire a new customer, every one of those new customers is losing you money. That’s why customer acquisition cost (CAC) is such an important KPI.
CAC is simple to calculate. Take your total sales and marketing costs, then divide that figure by the number of new customers you won in a given period (say, a month).
So if I spent €10,000 on sales and marketing in March and brought in 1,000 new customers, my CAC was €10.
Is that good? Depends.
CAC on its own tells you nothing. It only gains meaning when balanced against other KPIs—specifically, average order value and customer lifetime value. I’ll dig into them in the next two sections.
2. Average Order Value
Simply put, your average order value (AOV) is how much each customer spends at the tills.
To work it out, divide your total revenue by the number of orders you received. If I made €100,000 in revenue from 5,000 orders, my AOV is €20.
On its own, that number doesn’t tell me much. However, I already know my CAC is €10, so if my AOV is double that figure, there’s a decent chance I’m running a sustainable business. (I can’t be certain, though—for that, I’d need to know my customer lifetime value too.)
By tracking your AOV over time, you can accurately measure your attempts to increase it.
Why’s that so important?
Because acquiring customers is expensive. According to one widely quoted stat, it costs five times more to attract a new customer than to retain an existing one.
If you can drive up your average order value by just a few euros, you’ll make a lot more money, without having to spend any more on acquisition. It’s pretty much the most efficient way to grow an ecommerce business.
3. Customer Lifetime Value
The next piece in the “am I running a sustainable business?” puzzle is the customer lifetime value (CLV).
Simply put, CLV is the average net profit you make from each customer throughout their relationship with your brand.
To calculate CLV, you need to multiply three other metrics:
- Your average order value;
- How many times the average customer buys from you per year; and
- The average length of their relationship with you in years.
We’ve already worked out my AOV is €20. So if my average customer buys three times a year and sticks with me for five years, my CLV is €300.
Now we’re starting to get some real meaning from these numbers.
As a general rule of thumb, your CLV to CAC ratio should be at or above 3:1. I’m only paying €10 to acquire each customer, but I’m making €300 from them.
Based on these numbers, it looks like I’ve laid the foundations for a sustainable, high-growth ecommerce business.
4. Conversion Rate
You’ve done a ton of work to drive traffic to your site. You’ve invested in SEO, built social ads, and run paid search campaigns.
But all that time and money count for nothing if those visitors bounce straight back off the moment they land on your site.
That’s why conversion rate—the percentage of users who perform an action on your site—is another important KPI. It’ll tell you whether your key landing pages are working as intended.
You might need to track a range of conversion rates, because you likely have more than one “action” you want visitors to perform. Those actions could include:
- Opting in for your newsletter;
- Downloading a piece of content;
- Signing up for your loyalty program;
- Adding a product to cart;
- Buying a product.
Conversion rates will vary widely depending on the type of action you’re tracking. For example, looking specifically at purchases, the average global ecommerce conversion rate stood at 2.58 percent in Q2 2019.
A newsletter signup page might have a conversion rate of 20 percent because it’s a free, low-commitment transaction. On the other hand, I suspect the landing page for the €87,000 Tesla Model S converts at a slightly lower rate.
5. Shopping Cart Abandonment
While conversion rate measures the proportion of people who complete the desired action, shopping cart abandonment does the opposite. It charts the percentage of users who fail to complete the action of making a purchase from your ecommerce site.
To calculate your abandonment rate, divide your number of completed purchases by the number of shopping carts opened, subtract the result from one, and then express it as a percentage.
So if I have 4,000 completed transactions from 10,000 shopping carts created, that’s an abandonment rate of 60 percent.
That number sounds astonishingly high, but it’s actually way better than most. According to the Baymard Institute, the average shopping cart abandonment rate stands at almost 70 percent.
Why are all those merciless online shoppers adding-to-bag then failing to buy? Baymard Institute gives us lots of reasons:
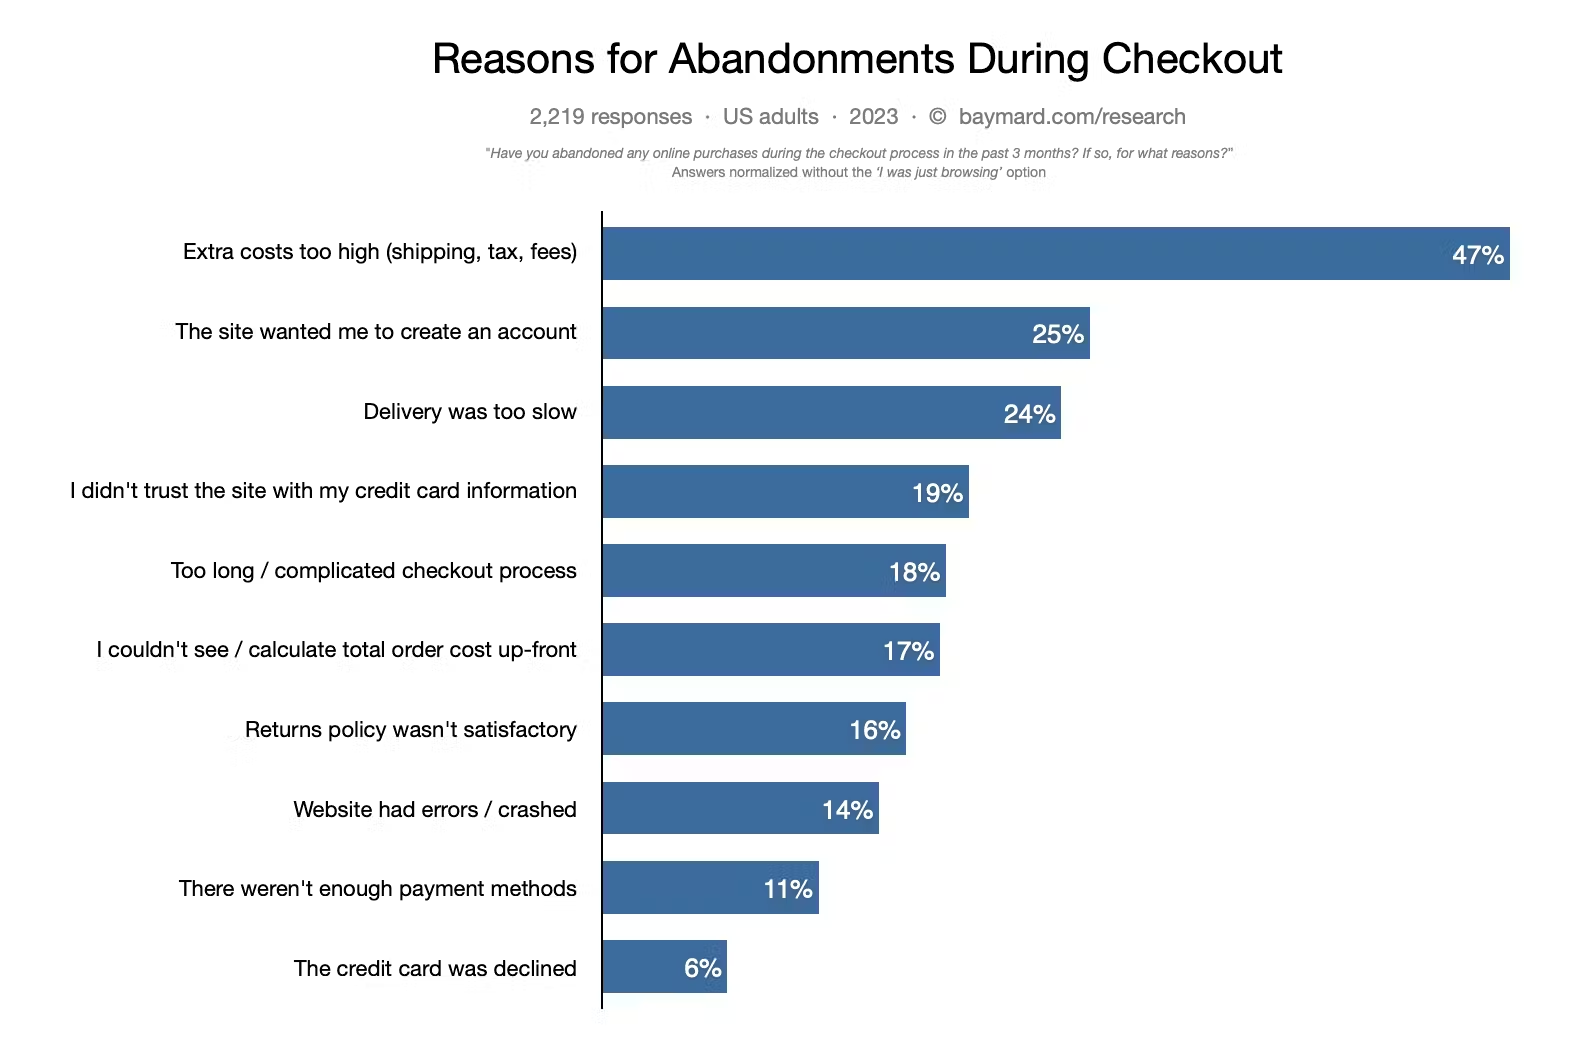 One final point from the above study: the average large ecommerce site could see a 35.26 percent upturn in conversion rate by designing a better checkout.
Considering the combined value of all ecommerce sales in the EU and US, that equates to an eye-watering $260 billion in lost orders that could be recovered through improved checkout design and flow.
6. Ad Impressions
With organic reach in decline, ecommerce brands are increasingly finding that social media and search marketing are becoming pay-to-play environments.
If you’re running paid activity, whether paid search or social ads, you need to have KPIs in place around your campaigns. Otherwise, how can you tell if it’s working?
There are lots of metrics you could be tracked here, but one of the most important is ad impressions—the number of times your ad is fetched from its source and displayed. That could happen on a social platform, on a search engine results page, in an app, or on a third-party site.
You can find information on impressions within your advertising platform of choice, whether that’s Google, Facebook, Instagram, or something else.
Impressions and clicks are not the same. Just because your ad was presented to someone, that doesn’t mean they interacted with it. So why are they such a big deal?
For me, there are two main reasons:
- Impressions are arguably the most controllable metric. If your impressions are dropping, that’s likely a sign you need to increase your budget and/or bid.
- Impressions control everything else. It doesn’t matter how compelling your ads are—if you’re not generating impressions, no one’s going to see them.
7. Return On Ad Spend
Another ad-specific metric, return on ad spend (ROAS) is pretty much what it sounds like—the amount of revenue you’re generating from your ad investment.
If I spend €10,000 on advertising for a return of €100,000, my ROAS is 10. Simple.
After impressions, it’s my second favorite ad metric (what do you mean you don’t have favorite ad metrics?).
That’s because it’s tied to your bottom line. Sure, cost per click, click-through rate, and conversion rate are all important too. But the only thing that really matters is whether your ads are making enough money.
As with CLV to CAC, the 3:1 ratio is a good guide to whether your return on ad spend is high enough. So if I’m spending €10,000 but only returning €20,000, my ad activity likely isn’t sustainable.
8. Email Open Rate
Much like impressions, this one isn’t specifically related to ecommerce. But email marketing is so essential to online retailers that I had to include it.
According to the latest Campaign Monitor figures, email generates an average return of $42 for every $1 invested. That’s way more than most brands will see from any other channel.
When it comes to measuring open rates, your chosen email marketing platform will do all the calculations for you. If you’re seeing rates of 15-25 percent, you’re doing okay (the higher, the better).
9. Gross Profit Margin
The last three metrics have all been campaign and channel-specific, so for my final entry, I’m going to zoom back out and look at a big, overarching metric.
Gross profit margin shows you the difference between the revenue you generate and the profit you earn off the back of it. To calculate it, you need to know two things:
- Total revenue: The number of units sold multiplied by the price.
- Cost of goods sold (COGS): Your total business costs, accounting for things like manufacturing, marketing, salaries, and operations.
First, subtract COGS from total revenue. That’ll leave you with your gross profit. Then divide that figure by total revenue to calculate your gross profit margin.
So if my total revenue last month was €100,000 and my COGS was €70,000, I made a gross profit of €30,000 at a margin of 0.3, or 30 percent.
A high gross profit margin is, obviously, a good thing. It leaves you with plenty of cash to invest back into the business.
On the flip side, if your margin is low, growth will be stunted, and you’ll likely run into cash flow problems.
Conclusion
Sure, most people don’t start an ecommerce business because they love tracking KPIs.
But they’ll always have some sort of goal in mind. Maybe it’s to become the biggest brand in their niche or to achieve a global presence. Or maybe it’s to sell the business for €1 billion, retire to a private island, and spend the rest of their days sipping mojitos.
Whatever your overarching objective(s), setting and monitoring individual KPIs will help you get there.