Email marketing statistics change about as quickly as Kim Kardashian changes outfits. Marketers must stay in tune with email marketing statistics because they have a massive impact on how we view the marketing landscape and how we conduct marketing activities.
In this article, we’ve compiled the latest and most noteworthy email marketing statistics for 2026. I’ll cover all of the key areas like current email marketing reach, mobile optimization, personalization, click-through rates, and so on.
So by the end, you’ll have a comprehensive view of what’s going on and can make more informed decisions regarding your campaign moving forward.
Here we go.
1. 6 Email Marketing Reach Statistics
Quick email marketing reach statistics:
- 99% of people check their email every single day. Source
- More than 50% of US respondents check their personal email account more than 10 times a day. Source
- 73% of millennials prefer communicating with brands through email than any other medium. Source
- During BFCM Weekend, repeat purchases made up 56% of all purchases – a 180% increase from the previous year. Source
- First purchases made up 44%, a 45% decrease from the previous year. Source
- Ecommerce merchants sent 48% more emails this year during BFCM weekend. The number of discounts increased by 52%, and gross revenue increased by 20% over 2022. Source
One of the main reasons why ecommerce brands have historically been so successful with this channel is the sheer number of people who use email daily.
Even though newer, sleeker, sexier digital marketing strategies are constantly popping up, email continues to be insanely effective because of this fact.
And this has never been more true than it is in 2026.
Recent data from HubSpot discovered that a staggering 99 percent of people check their email every single day.
Not only that, “more than 50 percent of U.S. respondents check their personal email account more than ten times a day, and it is by far their preferred way to receive updates from brands.”
Another fact I found interesting was that the vast majority of millennials (73 percent) prefer communicating with brands through email than any other medium.
There’s simply a level of convenience that email provides that’s hard to replicate.
So when it comes to reaching a massive percentage of your demographic promptly, email is still the top dog.
2. 6 Email Influence and Retention Statistics
Quick Email Influence and Retention Statistics:
- 59% of people say marketing emails influence purchase decisions. Source
- 80% of business professionals say they believe email marketing helps keep customers coming back. Source
- Loyalty and referral workflows had earned some of the highest revenue-per-workflow of any automated email over last year. Source
- The same loyalty and referral workflows earned 82% more revenue for ecommerce merchants YoY. Source
- Winback automated emails saw a 61% increase in revenue during BFCM weekend over the same weekend in 2022. Source
- Automated emails that earned the best open rates were birthday and anniversary workflows at 24.43%. Source
Recent data also suggests that email can be an integral channel for winning over ecommerce shoppers and motivating them to buy.
HubSpot specifically mentions that “59 percent of respondents say marketing emails influence their purchase decisions.”
This is especially true when you create beautiful emails with professional images and enticing promotions.
For example, this email from ban.do, a brand that specializes in fun-loving clothes, accessories, and planners, could pique a new subscriber’s interest by offering a 10 percent promo code.
It’s a great way to make an introduction and start building a relationship.
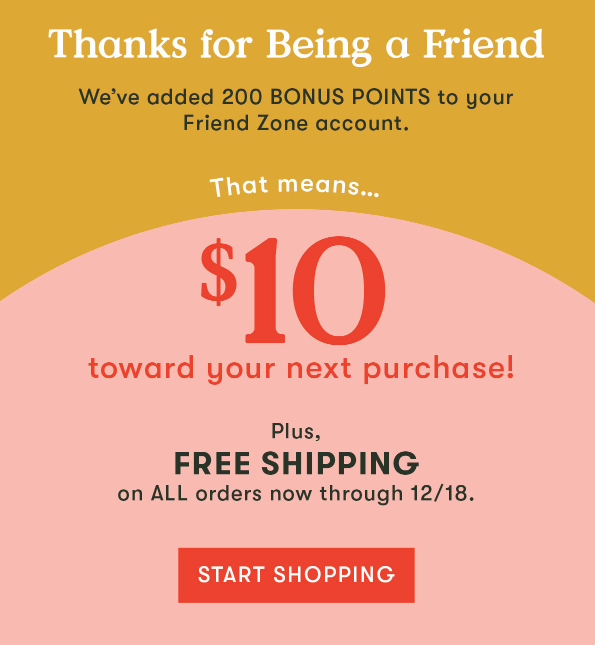
There’s also a noticeable correlation between email marketing and customer retention, where 80 percent of business professionals believe that it keeps customers around for longer.
And this makes sense when you consider that email often facilitates a deeper level of rapport and communication between ecommerce brands and customers. By keeping customers in the loop, you’re more likely to retain them.
Online fashion and cosmetics company ASOS is one of the best in the business at doing this and have consistently used email to win over consumers.
Here’s an example.

3. 3 Mobile Email Marketing Statistics
Quick Mobile Email Marketing Statistics
- 46% of all email opens now occur on mobile. Source
- 73% of companies today prioritize mobile device optimization when creating email marketing campaigns. Source
- 28.4% of people open mobile emails on an iPhone, followed by an iPad at 9.3% and Google Android at 2.3%. Source
The fact that a large number of users open their email on mobile devices is nothing new.
But we’re almost at the official tipping point in 2026 where mobile surpasses desktop, and HubSpot found that 46 percent of all email opens now occur on mobile.
So every time you push “send,” you can expect nearly half of all recipients to open it on a mobile device. This clearly shows the importance of creating mobile-friendly emails, and it’s something that leading ecommerce brands are doing.
“In fact, 73 percent of companies today prioritize mobile device optimization when creating email marketing campaigns.”
It’s also worth mentioning that more people open mobile emails on an iPhone than any other device at 28.4 percent, which is followed by an iPad at 9.3 percent and Google Android at 2.3 percent. This is something to keep in mind when you’re optimizing for screen size.
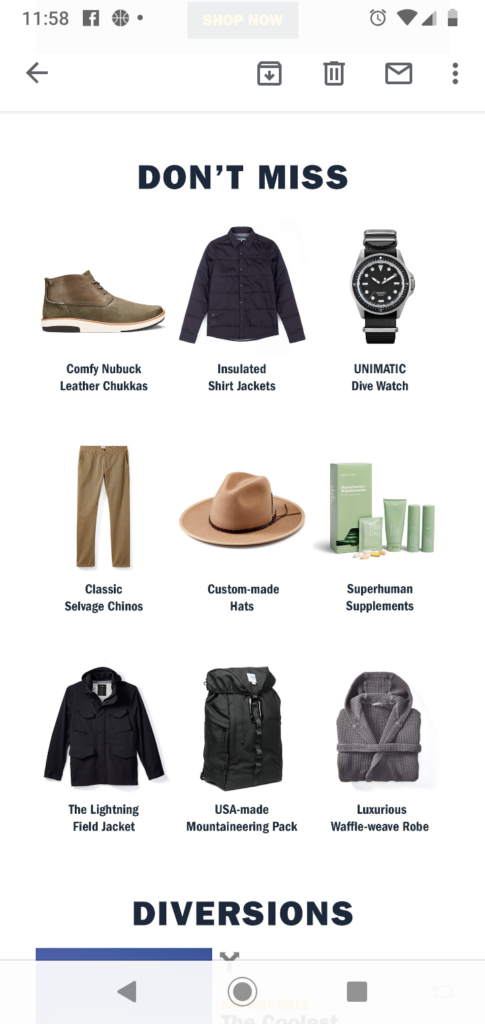
A good example of a company that’s winning with mobile optimization is Huckberry, who specializes in active and outdoor gear. They do an amazing job of creating extremely mobile-friendly emails that are visually striking and simple to scroll through.
In a recent email, they highlight a new product called the Waxed Trucker Jacket and provide a nice description using easy to read dark text with plenty of contrast from the white background.
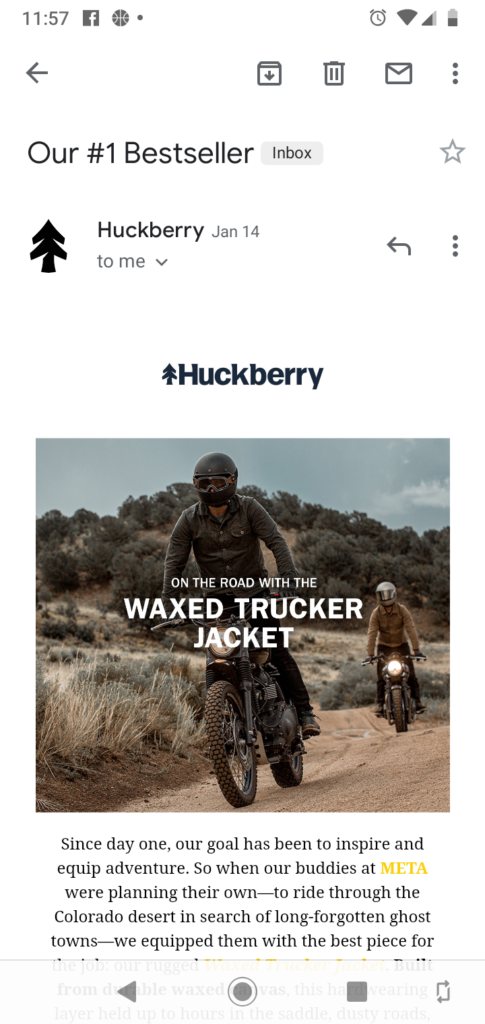
They include several pictures along with a bulleted list of features so you can easily digest the information.
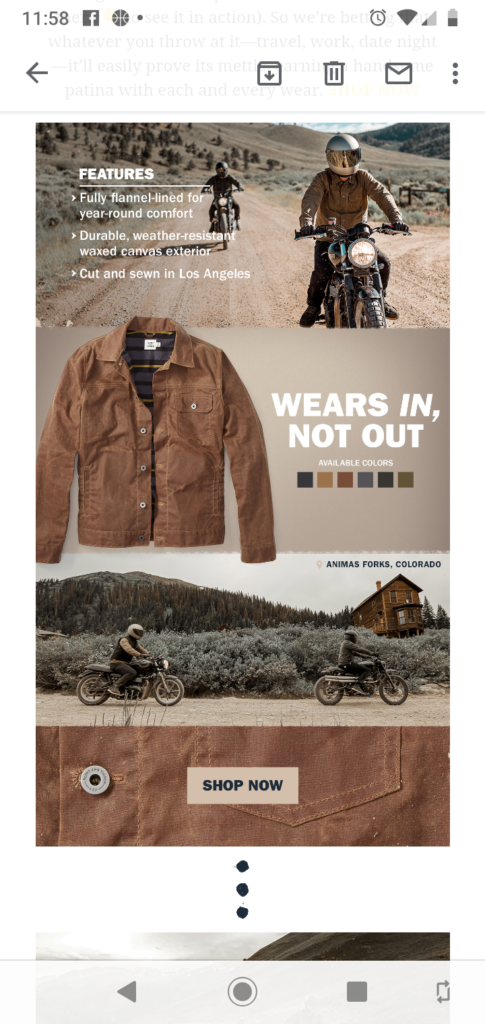
They also throw in some “don’t miss” products and make them simple to tap on without accidentally hitting another product by mistake.
For an in-depth guide on the fundamentals of creating fully responsive emails, I suggest checking out this post from Campaign Monitor. It’s super helpful and will show you the ins and outs behind the process.
4. 7 Email Personalization Statistics
Quick Email Personalization Statistics:
- Personalized emails have an 18.8% average open rate vs non-personalized emails which average 13.1%. Source
- 50% of companies feel they can increase email interaction by increasing personalization. Source
- Segmentation has afforded brands a 760% increase in revenue generation. Source
- In 2023, only 1 in 5 ecommerce merchants were using at least one segment for email marketing. Source
- The 20% of ecommerce merchants using segmentation earned 80% of all revenue generated last year. Source
- On average, merchants using two or more segments earned 17x the revenue earned by ecommerce merchants using only one segment. Source
- Segmented emails increased by 29% percent YoY over BFCM weekend. Source
Personalization has become integral to many aspects of digital marketing, and email is no exception. There’s a solid body of evidence that shows personalization can have a huge impact.
For starters, personalized emails have an average open rate of 18.8 percent, while those that aren’t personalized have an average open rate of 13.1 percent. That’s a 5.7 percent difference.
This is why it’s so important to include a subscriber’s first name whenever possible. Next, “50 percent of companies feel they can increase interaction with email by increasing personalization.” And it’s easy to see why.
Subscribers naturally want to engage more with emails that are tailored to their preferences, shopping behavior, prior purchases, and so on.
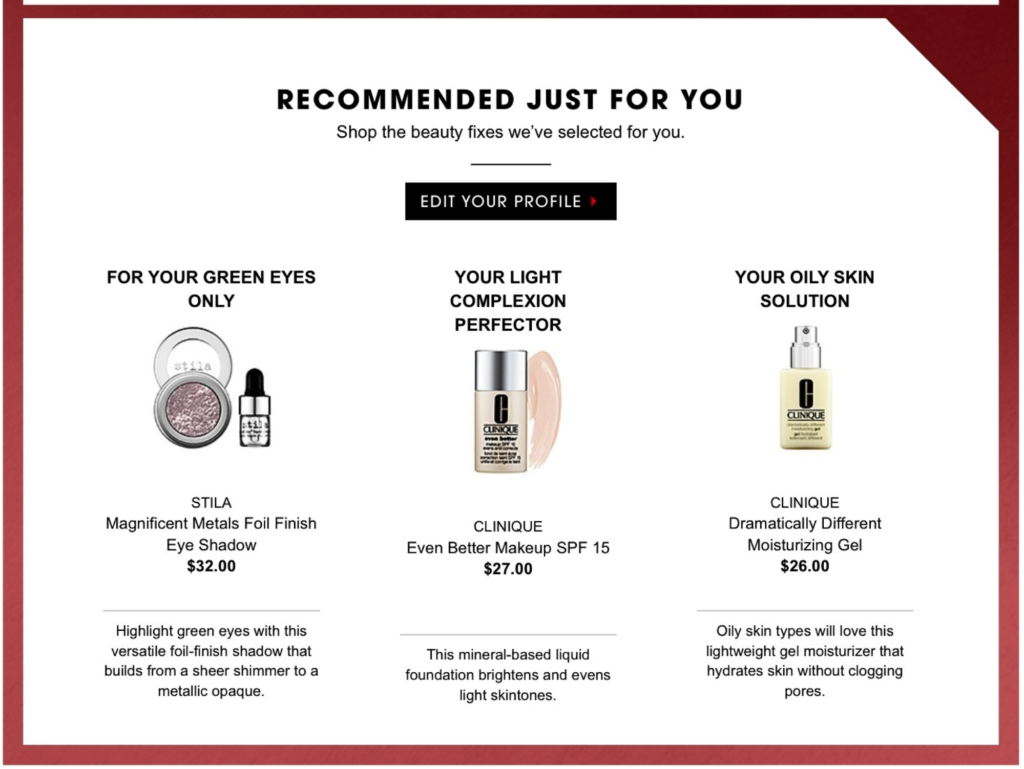
One company that has leveraged this technique well and used it to their advantage is Clinique Cosmetics. Here’s an email where they provide “beauty fixes” that were selected based on a shopper’s unique needs.
In terms of revenue generated from personalization, brands have seen a 760 percent increase by segmenting their campaigns. This shows just how potent this strategy can be and that it’s worth your time in 2026.
5. 6 Email Click-Through Statistics
Quick Email Click-Through Statistics:
- Including video in your emails can increase CTR by 300%. Source
- Adding a call-to-action button in your emails instead of simply a text link can lead to a 28 percent increase in click-throughs. Source
- Adding social share buttons can boost your CTR by as much as 158 percent. Source
- Referral and loyalty campaigns earned the highest CTR in 2023 at 25.15%. Source
- Welcome automations earned the second highest CTR at 24.46%. Source
- The three highest automated email workflows by CTR were Referral/Loyalty, Welcome, and Giveaway. Source
Getting a subscriber to open an email is important, but it’s only half the battle. The bigger goal is to get them to click-through and check out your offer.
Recent data found there are two key ways to increase your click-through rate (CTR). One is to include videos in your emails—a technique that can increase your CTR by a whopping 300 percent.
This is something jewelry brand Monica Vinader has pulled off brilliantly in their email campaigns. Take this one, for instance, that shows the design process that went into one of their products, the Signature Diamond Bangle.

Besides just using videos, you may also want to consider animated GIFs, like this one from British clothing company Boden.
The alternating colors on the different clothing items are a definite attention grabber and do a great job of showing shoppers the style options they have.
Another interesting stat involves call-to-action buttons. “Adding a call-to-action button in your emails instead of simply a text link can lead to a 28 percent increase in click-throughs.”
Here’s a good example from personal care and beauty brand Sephora.
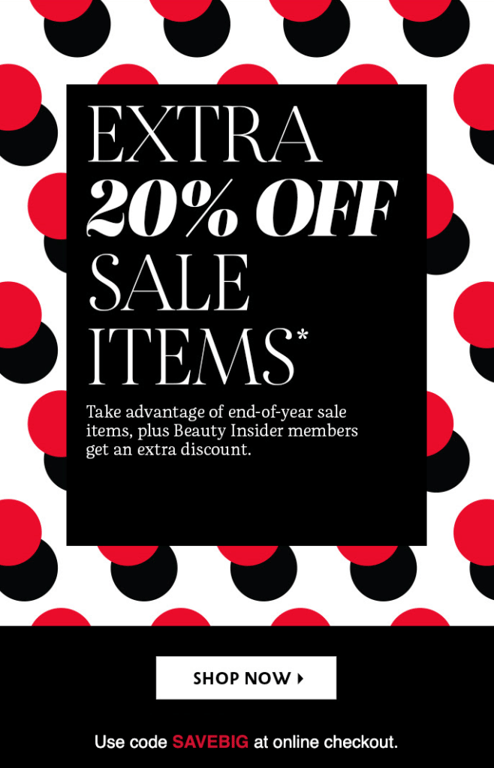
Notice how the white CTA at the bottom stands out from the rest of the copy to grab a subscriber’s attention.
It’s also worth noting that adding social share buttons can boost your CTR by as much as 158 percent.
Check out how online retailer Lavish Alice seamlessly includes buttons to their Instagram and Facebook at the bottom of this email.

Using strategies like these are fairly straightforward but can have a tremendous impact on your CTR long-term and are worth experimenting with.
6. 2 Email Frequency Statistics
Quick Email Frequency Statistics:
- Most brands (54%) send emails 2-4 times per month. 32% send emails once a month. 8% send emails 5-9 times per month. The last 6% send more frequently. Source
- Sending emails once a month had the highest open rate at 28%. Sending 2-4 emails a month had the second highest open rate. Source
There has been a substantial amount of research done over the years to identify the optimal frequency for sending emails. One of my favorites is from a couple of years ago.
It found that most brands (54 percent) send emails 2–4 times per month, 32 percent send emails once per month, 8 percent send emails 5–9 times per month, and the remaining percentage send emails more frequently than that.
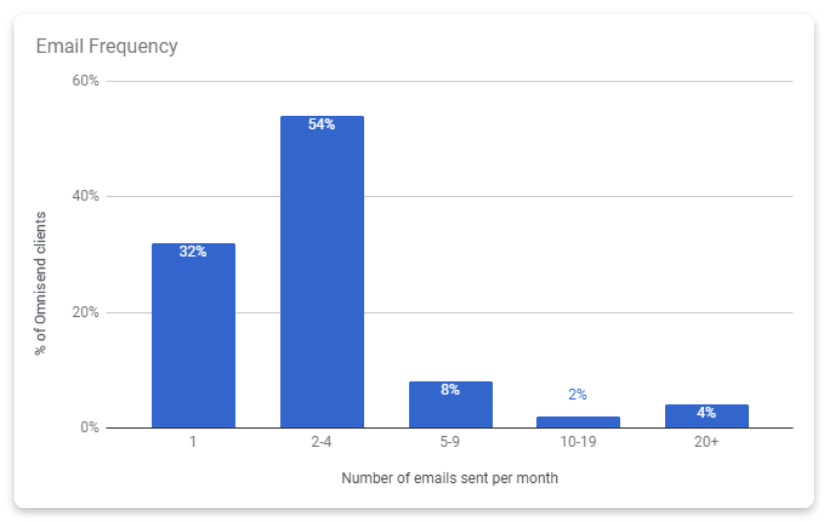
According to the data, sending emails once per month had the highest open rate at 28 percent, and sending emails 2–4 times per month had the second-highest open rate at 21 percent. 2020 research unearthed similar findings and indicates that less is still best when it comes to email frequency.
However, it’s now optimal for most ecommerce brands to send two emails per month, as these companies experience the highest open rates.
And I think this is the perfect sweet spot these days. You want to maintain steady contact so that subscribers don’t forget about you. But you don’t want to annoy them by clogging up their inbox with excessive emails.
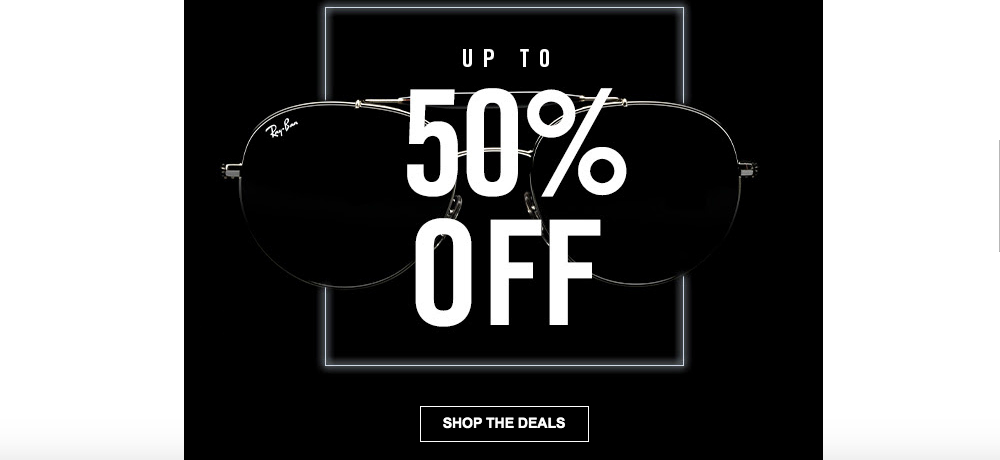
So sending an email every couple of weeks or so to average two a month total is usually a good number to shoot for. That’s about the frequency that Ray-Ban uses, and it works well for them.
For instance, I got this email on November 27.
And then I got this one on December 13.
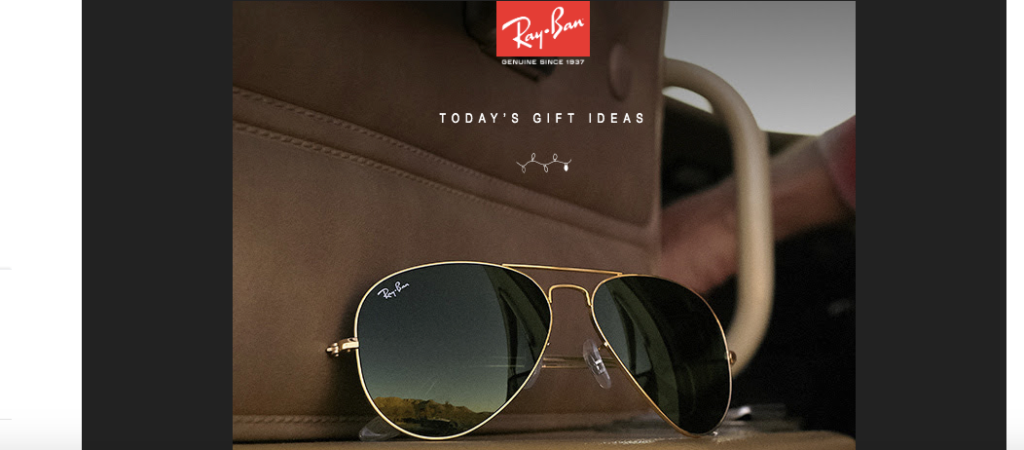
It was enough to keep them on my radar, but it wasn’t so much that it created any friction.
7. 8 Abandoned Cart Email Statistics
Quick Abandoned Cart Email Statistics:
- 47% of marketers believe email is the best channel for lead nurturing. Source
- 45% of abandoned cart emails are opened. Source
- 21% of cart abandonment emails are clicked, with the shopper returning to look at their cart. Source
- Of the subscribers that click through, 50% will finish their purchase. Source
- Cart abandonment emails generated the second highest amount of revenue last year (just after welcome campaigns). Source
- Cart abandonment automated emails earned, on average, a 17.17% open rate for ecommerce merchants. Source
- Abandoned cart emails earned a 17.98% CTR rate. Source
- Cart abandonment emails made up a quarter of all emails sent in 2022. Source
Email is one of the best channels pound-for-pound for lead nurturing.
Forty-seven percent of marketers even believe it’s the number one lead nurturing tactic.
Even if an ecommerce shopper isn’t ready to buy right off the bat, email provides you with an effective way to warm them up until they are ready. And one of my favorite techniques for doing this is abandoned cart emails.
There’s recent data that shows just how receptive many shoppers are to this strategy and how big of an impact it can have. First of all, 45 percent of abandoned cart emails are opened, which I think is pretty amazing.
So, in theory, nearly one out of every two subscribers will check out your content.
Out of the emails that are opened, 21 percent receive clicks where shoppers will go back and check out what they left in their shopping cart. And of the subscribers who click-through, 50 percent of them will ultimately make a purchase.
Abandoned cart emails simply remind shoppers of what they had an initial interest in but weren’t compelled to buy at the time. So as you can see with these statistics, it’s often the subtle nudge many people need to go ahead and complete a purchase.
Here’s an example of an abandoned cart email from women’s clothing company Kat Von D Beauty.
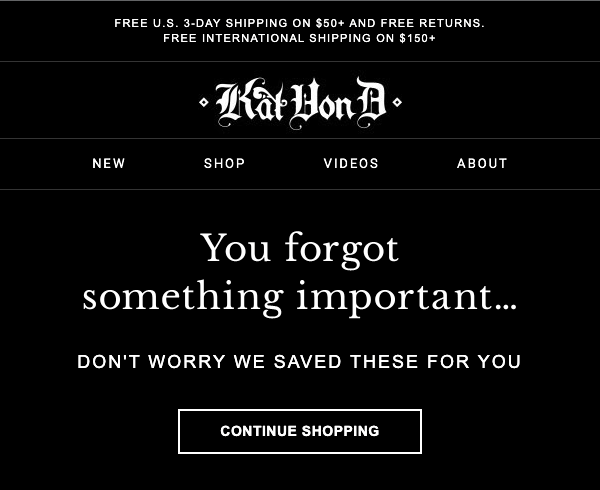
It’s very straightforward.
They point out two products that a shopper added to their cart and include images to remind them what the products look like. Kat Von D Beauty also uses some well-written, playful copy saying, “You forgot something important. Don’t worry; we saved these for you.”
I also like this email from Rent the Runway, a brand that offers designer dress and accessory rentals.
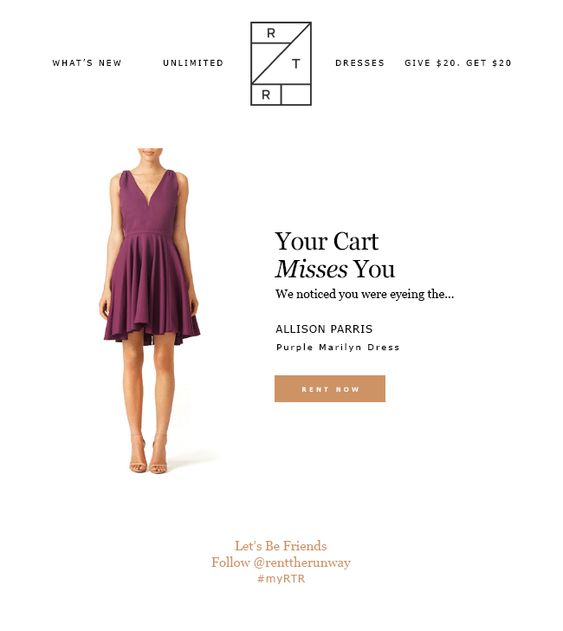
It’s also quite simple and features a dress a shopper left behind, along with a nice CTA to rent it now.
This goes to show that you don’t necessarily need to do anything fancy to make this strategy work. You just need to succinctly display the products a shopper added to their cart using professional images and throw in a well-placed CTA.
Do that, and fewer of your leads should get off the hook.
Conclusion
Regardless of how many new, cutting-edge marketing channels arise, email refuses to be supplanted. As long as people keep checking their email, it should remain a viable channel for reaching shoppers and motivating them to buy.
That said, trends certainly change, and ecommerce store owners must pay close attention to what’s happening. The email marketing statistics I provided here should give you a good idea of what you can expect in 2026, so you can focus on the right areas.
That way, you can get the most from your campaign and stay ahead of the competition.