
Mobile commerce, also known as m-commerce, is defined as “the buying and selling of goods and services through wireless handheld devices such as smartphones and tablets.”
It’s a big umbrella that can include everything from ecommerce and in-app purchasing to mobile banking and purchasing goods using a digital wallet.
But what I want to specifically focus on here is the ecommerce side of things.
In this article, I’m going to list 19 of the most interesting mobile commerce statistics that show just how big of a role it plays in modern ecommerce.
I’ll also include plenty of data that demonstrates why it’s so essential to create a smooth, fluid experience for mobile users.
So let’s get started.

Table of Contents
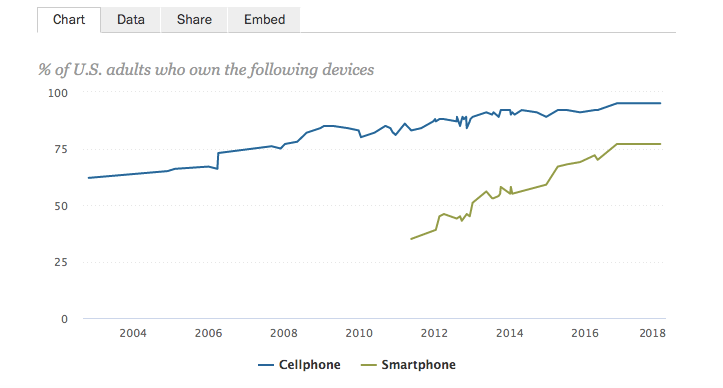
1. 77 Percent of Americans Owned a Smartphone in 2018
Nearly all Americans (95 percent) owned some type of cell phone as of February 2018.
And 77 percent owned a smartphone, which is a massive increase from just 35 percent in 2011.
This graph from the Pew Research Center illustrates how much growth in smartphone ownership took place in just seven years.
2. 53 Percent of Americans Owned a Tablet in 2018
In terms of tablets, over half of the US population owned one as of January 2018.
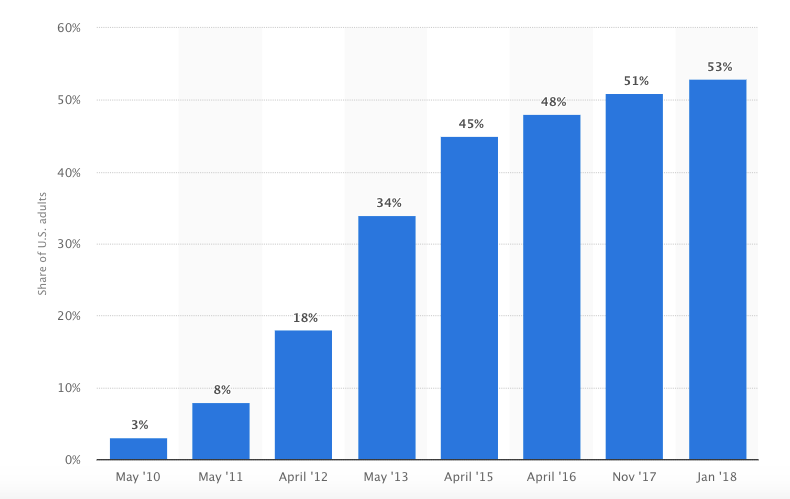
While not nearly as big as smartphones, tablets are still quite popular, and ownership could climb as high as 60 percent within the next five years.
3. Americans Spent More than 3.5 Hours on Their Mobile Devices Per Day in 2018
Not only do the vast majority of Americans use mobile devices, they use them a lot.
In 2018, the average US adult spent 3 hours and 35 minutes per day on their device—an annual increase of more than 11 minutes.
Much of this time is spent on texting, social media and entertainment. But of course there’s also plenty of shopping taking place.
4. 63.4 Percent of People Accessed the Internet on a Mobile Device in 2019
The official “tipping point” where more people accessed the Internet on mobile rather than desktop was back in 2015, where global mobile phone Internet user penetration was 52.7 percent.
In 2019, that number has grown considerably, and now more than 63 percent of people access the Internet on a mobile device.
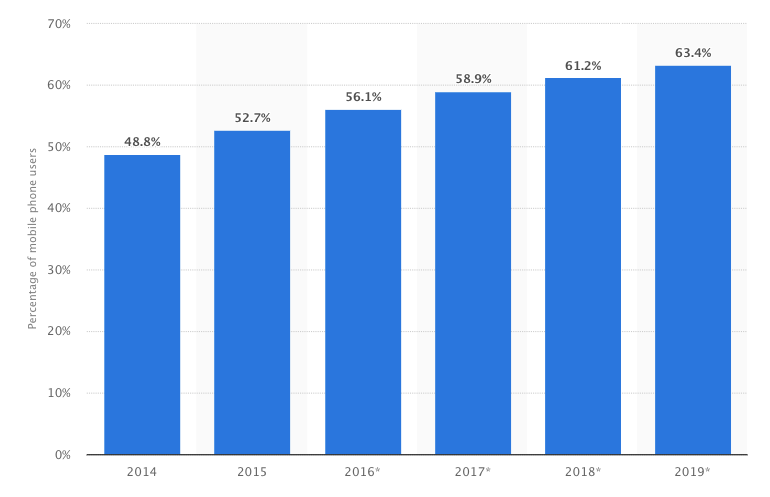
Mobile is clearly the medium of choice and will only continue to become more popular in the future.
So these numbers demonstrate just how vital it is for ecommerce owners to provide a seamless experience for mobile users.
5. Just Over Half of Americans Bought Something Online Using a Smartphone in 2016
As of December 2016, 79 percent of Americans had purchased something online.
Of these shoppers, 51 percent had completed an online purchase using a smartphone.
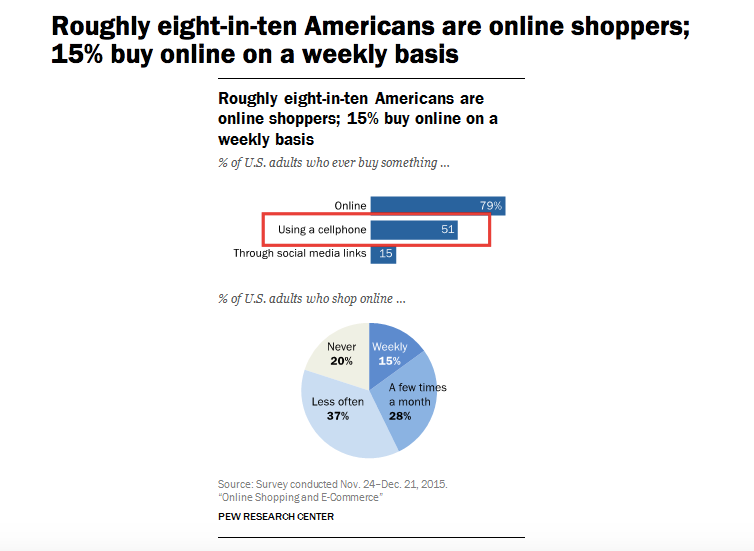
Now that we’re in mid-2019, that number has likely grown, showing the majority of people are comfortable doing ecommerce shopping on a mobile device.
6. Mobile Commerce Accounted for Nearly a Quarter of Digital Commerce Spending in Q4 2017
During the fourth quarter of 2017, “it was found that 24 percent of all digital ecommerce dollars were spent via mobile devices.”
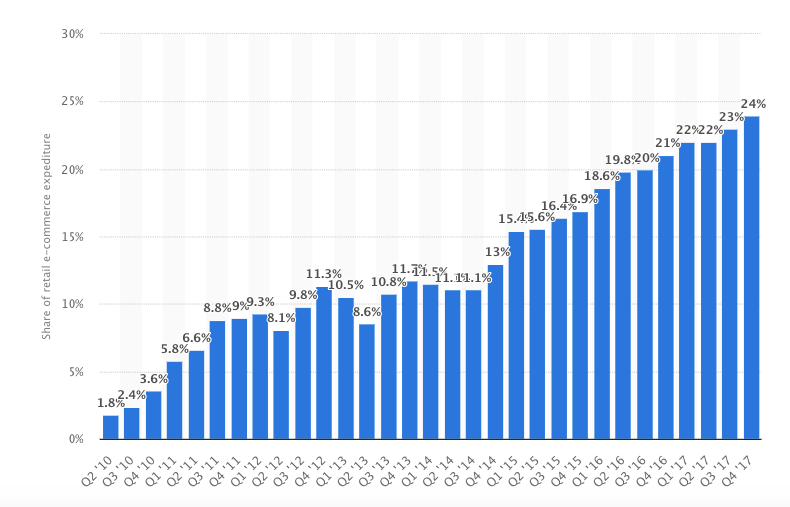
This was a significant increase from just 13 percent in the fourth quarter of 2014 and shows how much mobile commerce has grown in a relatively short period of time.
7. Mobile Commerce Sales Will Make Up More Than Half of Total Ecommerce Sales By 2021
And don’t think the mobile commerce trend is slowing down.
Experts predict that by 2021, mobile commerce will account for 53.9 percent of ecommerce sales.
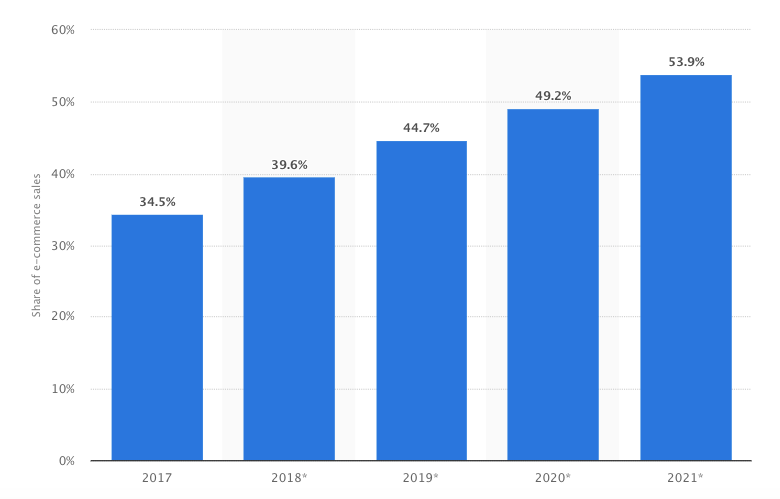
This makes 2021 the tipping point where more ecommerce shopping is done on mobile than on desktop.
While you certainly don’t want to neglect desktop users, this data proves that mobile users deserve the bulk of your attention in upcoming years.
8. 93 Percent of Millennials Compared Online Deals Using a Mobile Device in 2018
Mobile devices are effective tools for quickly comparing deals.
Young shoppers are especially fond of this tactic, with 93 percent using it to find savings between multiple competitors.
As an ecommerce owner, you can capitalize on this trend by offering better deals and promotions than your main competitors.
Beyond that, optimizing your site’s interface so mobile users can quickly find product specifications, pricing, shipping information, and so on can give you an edge.
For example, indoor potted plant delivery provider, The Sill, has super informational product pages that tell shoppers everything they need to know at a glance.

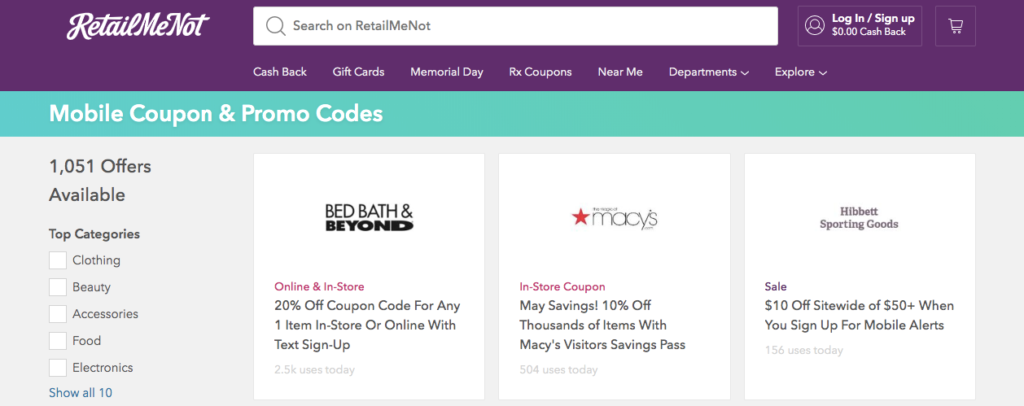
9. More Than 90 Percent of Mobile Coupon Users Redeemed a Coupon Code in 2018
Coupons have been popular for awhile, with 85 percent of Americans using them.
Unsurprisingly, mobile coupons are also huge, with more than 90 percent of mobile coupon users redeeming a code in 2018.
That’s why you see a lot of major brands offering mobile coupons on sites like RetailMeNot.
Here’s an example of one from American Eagle giving mobile shoppers 25 percent off by entering a code.
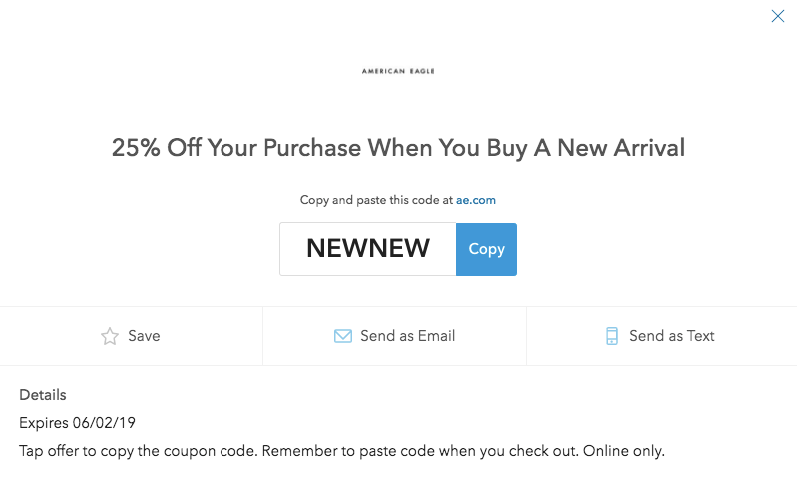
If you’re looking for an effective way to entice ecommerce shoppers to choose your store over competitors, this is definitely something to consider.
10. The Global Mobile Coupons Industry is Expected to Grow By 56.5 Percent By 2025
If you need any more encouragement, note that more than 25 million Americans used mobile coupons in 2018, and that number will increase by 56.5 percent over the next six years.
This is hands down one of the best ways to attract new prospects and get first-time customers to go through with their purchase.
Beyond that, it can help you quickly move inventory that isn’t selling all that well.
11. Tablets Have a Conversion Rate of 3.71 Percent, and Smartphones Have a Conversion rate of 1.56 Percent
In the third quarter of 2018, tablets had more than double the conversions of smartphones among US online shoppers.
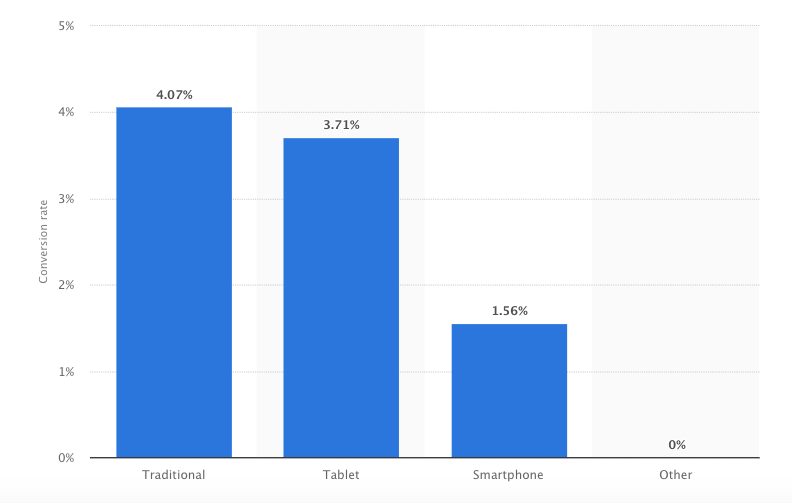
While the exact reason for this is open to interpretation, over lengthy or cluttered copy is a common culprit, especially when there’s limited real estate on a smartphone screen.
Minimizing the “informational dump” and simplifying the design can be a big help for raising smartphone conversion rates.
12. Smartphone Users Are Most Likely to Abandon Their Shopping Carts at 85.65 Percent
Shopping cart abandonment is a major concern for ecommerce site owners.
While the abandonment rate for desktop users is roughly 73 percent, it’s significantly higher for mobile users at 85.65 percent.
In fact, people are more likely to abandon a shopping cart using a smartphone than on any other device.
The reason?
“Often, sites aren’t optimized for mobile, meaning a clunky, glitchy checkout experience that leaves customers running,” explains CreditDonkey.
Robust mobile optimization is important for all aspects of ecommerce, but it’s especially critical during the checkout process.
It needs to be smooth and friction free with no hiccups that could prevent shoppers from completing their purchase.
13. Tablet Users Have a Slightly Lower Abandonment Rate at 80.74 Percent
Shoppers using tablets are slightly less likely to abandon their shopping cart, but the abandonment rate is still considerably higher than for desktop users.
This means there’s plenty of room for improvement, and performing A/B testing is a great way to gradually decrease the abandonment rate for both types of mobile devices.
14. Roughly 90 Percent of Mobile Time is Spent on Apps
There’s a huge disparity between the amount of time mobile users spend in browsers and on apps.
Research has found that the vast majority of time (90 percent) is spent on apps, with the remaining 10 percent spent using browsers.
Going even more granular, “Mobile app users spend an average of 201.8 minutes per month shopping, compared to 10.9 minutes/month for website users,” according to JMango 360.
What’s the reason for this disparity?
It’s simple. “Consumers prefer apps over mobile sites due to user experience, speed, extra features and special offers.”
Apps tend to create a much smoother UX than mobile sites, making it easier for shoppers to find what they need and complete their purchase with minimal hassle.
15. Mobile Shoppers Make Double the Purchases on Apps Than They Do on Mobile Web
What’s really interesting is the actual sales volume that apps generate when compared to mobile web.
One particular report found shoppers made 108 percent more purchases using apps than they did on mobile web during the 2017 holiday season.
16. Apps Have a 14 Percent Higher Conversion Rate Than Mobile Web
Furthermore, ecommerce site owners can expect a far higher conversion rate with an app than with mobile web.
Shoppers convert at a 14 percent higher rate, meaning there’s way more revenue potential.
These numbers clearly prove the growing importance of ecommerce stores having an app. Though it may require a considerable investment, it’s usually worth it in the long run.
A good example of a brand that’s pulled this off well is fast-fashion clothing company H&M.
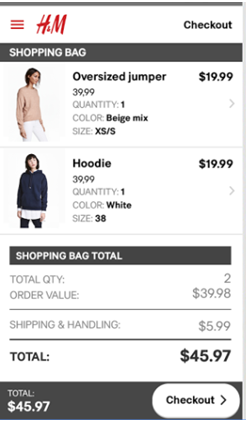
Their app has an excellent design with a book style product menu and ultra simple checkout.
17. 58 Percent of Smartphone Users Are More Likely to Buy When They Can Make Purchases Quickly
It should also come as no surprise that speed is important.
Time is of the essence, and a slow, arduous mobile shopping experience can really take a toll on conversions.
When a mobile user is having an “I-want-to-buy” moment as Think With Google calls it, you need to make the shopping process as quick and painless as possible.
Customer experience expert, Melanie Crissey, says ecommerce shops should aim for a maximum load time of three seconds because a large percentage of shoppers will leave after that.
She also recommends avoiding too many steps to complete a purchase and not requiring shoppers to fill out an excessive amount of form fields, as this creates friction.
But as long as you get it right and allow mobile users to make purchases quickly, 58 percent are more likely to buy.
Further Reading
18. 61 Percent of Smartphone Users Say They’re More Likely to Buy When They Receive Customized Offerings
Personalization has become a big part of providing a positive user experience in recent years and is something many people have come to expect.
And mobile users are no exception.
61 percent of smartphone users say customized offerings like similar products based on what a shopper has previously purchased makes them more likely to buy from an ecommerce brand.
So you’ll definitely want to look for ways to work personalization into your mobile commerce gameplan.
Further Reading
19. Less Than One in 10 Mobile Users Will Stay on a Site or App if it Doesn’t Satisfy Their Needs
And what about the consequences of not providing a positive experience for mobile users?
They’re pretty severe, with only nine percent of users saying they’ll hang around if a site or app isn’t up to par.
Even worse, it can create issues later on down the road, with 66 percent of mobile users taking actions that will have a negative impact on an ecommerce brand.
“40 percent will be less likely to come back to the mobile site or app, and 28 percent will be less likely to purchase products from the company in the future.”
In other words, users have very little patience for a poor mobile experience, and making the wrong first impression can have a lasting impact.
This proves just how important it is to take mobile optimization seriously and do everything within your power to keep users happy.
Conclusion
There’s a mobile revolution happening where in just a few short years mobile commerce will be the norm.
As an ecommerce site owner, it’s vital that you acknowledge this fact.
You also need to understand the mindset of mobile users, their preferences and what compels them to buy.
The 20 mobile commerce statistics mentioned here cover all of the bases and should provide you with the insight needed to deliver an amazing mobile experience.